Nonlinear Analysis of Gear-Fatigue-Damage Under Variable Load
Until the end of the 19th century, the dimensioning of mechanical structures and parts was based solely on static strength. If this characteristic value of any material or structure is exceeded even once, a failure is very likely. Therefore, engineers designed parts in a way that the static strength is sufficiently higher than the highest load expected in the service. In 1875, an Austrian train derailed between the cities of Linz and Salzburg due to a wheel breakage. Fortunately, no fatalities had to be reported, but the investigation of the accident was challenging. (Ref. 1). The failure could not be explained with any known theory. In this context, Wöhler (Ref. 2) discovered the correlation between reduced strength and dynamic loads and thereby created the fundamentals for fatigue life analysis.
Fatigue life analysis is the umbrella term for summarizing the theories and methods for calculating the service life of components under dynamic and in most cases variable load. Damage accumulation hypotheses (DAHs) are one major part of fatigue life analysis. If variable loads occur during operation, a DAH is required to calculate the service life or to dimension the load-carrying capacity of any component or structure accordingly. The oldest and still most widely used approach to damage accumulation is the linear one. This approach dates back to the first half of the 20th century and was developed and published by Palmgren (Ref. 3) and Miner (Ref. 4). Due to neglecting the sequence of variable loads and assuming a linear growth of the damage, this approach is mathematically simple and easy to apply for nearly any use case. Today, the linear approach is also the most common for calculating the service life of gears under variable load. International standards like ISO 6336-6 (Ref. 5) or ANSI/AGMA 2101-D04 (Ref. 6) recommend the use of this approach for the calculation of gears.
Although the linear approach to damage accumulation is commonly used and the results enable a reliable dimensioning of gears, research has shown that the sequence of loads can lead to a significant change in the service life of gears (Refs. 7–9). Because of this shortcoming of the linear approach to damage accumulation the nonlinear approach exists. The nonlinear approach can consider the load sequence when calculating the damage but comes with the tradeoff of increased complexity.
This paper presents a comparison of the linear and nonlinear approaches for damage accumulation of tooth root breakage damage of gears. In the beginning, the theoretical fundamentals of damage accumulation are presented compactly. To compare the suitability of the methods an extensive set of experimental data is presented at first. The data is evaluated with both the linear and the nonlinear approach and the results are compared. For the linear approach, the method according to Miner (Ref. 4) and Palmgren (Ref. 3) is applied. For the nonlinear approach, the method developed by Subramanyan (Ref. 10) is used. The objective of this evaluation is to assess if the more complex method yields a potential benefit for a more accurate service life prediction of gears.
Theory of Damage Accumulation
Load Carrying Capacity and the S/N Curve
Gears can fail due to different failure modes. For the fatigue life analysis of gears, pitting and tooth root breakage are of particular importance. Damage modes like scuffing, which can occur after a few load cycles under critical conditions, cannot be analyzed with the methods of fatigue life analysis. To describe the load carrying capacity of gears under different loads, the S/N curve (also known as Wöhler curve) is common. The S/N curve includes information on how many load cycles of a certain load level can be withstood by the gear. Figure 1 shows a schematic S/N curve.
Figure 1—Schematic S/N curve (Ref. 11).
Failure of machine elements is always fraught with scattering. Because of this, an S/N curve represents a certain probability of failure (Ref. 12). A failure probability of 1 percent, 50 percent or 99 percent is the most common but other values such as 10 percent or 90 percent are also used. To specify a S/N curve for a material or a machine element, a complex and extensive test procedure, often called the Wöhler-test, has to be conducted (Ref. 13).
The load in Figure 1 is divided into three ranges:
- Loads higher than the static strength (red zone)
- Loads between the endurance limit and the static strength (yellow zone)
- Loads below the endurance limit (green zone)
Loads exceeding the static strength have to be avoided entirely because they will most likely cause an immediate failure of the gear. A load below the endurance limit is considered nondamaging up to a certain amount of load cycles. For gears, this threshold of load cycles is usually chosen between 6 and 100 million load cycles and should exceed the expected service life of the gear. A load between the endurance limit and the static strength can be withstood by the gear for a certain amount of load cycles. To calculate the number of allowable load cycles, the Basquin equation (Ref. 14) is applied:

(1)
where
N is the number of allowable load cycles
C is the constant describing the position of the S/N curve
L is the load corresponding to the number of allowable load cycles
k is the slope of the S/N curve
For use cases with a nonvariable load, the S/N curve can be used directly to calculate the expected service life according to Equation 1. For cases of variable load, a DAH is required.
Damage Accumulation Hypotheses
Calculating the combined damage of a sequence of variable loads is one of the most important aspects of fatigue life analysis. Therefore, a lot of different DAHs have been published over time (Ref. 12). The objective of all of these hypotheses is to represent the process of damage growth as realistically as possible, while still remaining as generally valid as possible. Important to mention is the fact that the damage is represented by a damage sum D, which is usually considered to be zero for a new component and starts increasing from the beginning of the service life. In the theory of fatigue life analysis, a component is considered damaged to a certain degree as soon as the first damaging load is applied, even if there is no detectable damage, like a crack. DAHs can be categorized into linear and nonlinear hypotheses.
Linear Damage Accumulation Hypotheses
In general, linear DAH traces back to the theory according to Palmgren (Ref. 3) and Miner (Ref. 4) and is based on the following assumptions:
- Every load cycle of a certain load level causes the same amount of damage.
- The amount of damage caused by any load cycle does not depend on the previous damage already caused to the component.
These assumptions basically lead to an entire neglect of the load sequence. Therefore, it is possible to use a load spectrum instead of the actual load sequence, which in many cases is the only feasible way because the load sequence is not known during the design process. On the other hand, in many cases, the load spectrum can be estimated with a certain amount of reliability. To generate a load spectrum, the occurring range of load is divided up into a certain amount of load levels, and the occurring load cycles are categorized accordingly (Ref. 5). For gears, every tooth of a gear is exposed to one load cycle for every revolution of the gear. Due to this characteristic, it is possible to transfer a load sequence into a load spectrum without the use of complex methods such as the Rainflow-counting algorithm. Figure 2 shows a schematic load sequence and the corresponding load spectrum. Additionally, the load sequence of one single tooth is plotted.
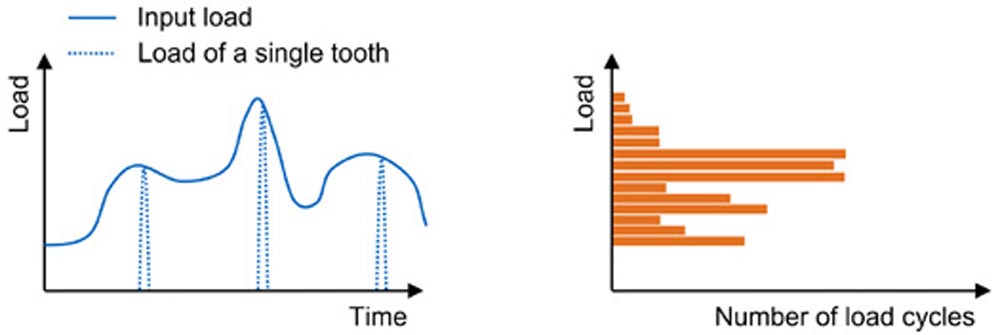
Figure 2—Schematic load sequence (left-hand side) and load spectrum (right-hand side).
The damage sum D caused by a load spectrum according to Palmgren (Ref. 3) and Miner (Ref. 4) is calculated as the sum of damage caused on every single load level:

(2)
with

(3)
where
D is the damage sum
di is the partial damage of the load level i
ni is the number of load cycles on the load level i
Ni is the number of allowable load cycles on the load level i according to Equation 1
In its original form, the DAH according to Palmgren (Ref. 3) and Miner (Ref. 4) (also referred to as “Original Miner”) does not consider any load levels lower than the endurance limit. Therefore, it is assumed that all load cycles of the corresponding load levels do not cause any damage. Especially high loads can result in a decreasing endurance limit throughout the service life (Ref. 9). This effect can result in an underestimated damage sum, not representing the actual state of damage and overestimating the service life. To include this into the DAH, two variations of “Original Miner” were developed:
- Elementary Miner: This DAH ignores the endurance limit and calculates the number of allowable load cycles according to Equation 1 for every load level.
- Miner-Haibach: The DAH “Elementary Miner” attributes load levels below the endurance limit with a high contribution to the total damage. This often leads to a very conservative damage estimation. Therefore, Haibach (Ref. 12) developed a DAH based on the Miner hypotheses, but with a reduced slope of 2k-1 for loads below the endurance limit.
Figure 3 shows the number of tolerable load cycles as assumed by the three presented DAHs based on the theory according to Palmgren (Ref. 3) and Miner (Ref. 4).
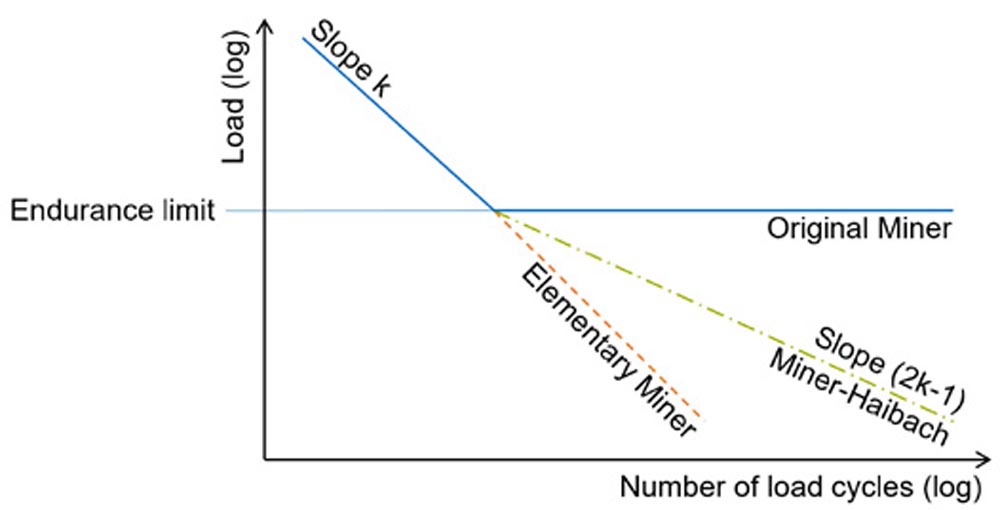
Figure 3—Number of tolerable load cycles as assumed by the DAHs based on Palmgren and Miner (Ref. 11).
Nonlinear Damage Accumulation Hypotheses
Nonlinear DAHs are designed to take the load sequence into account. Therefore, they cannot use load spectra as input. Instead, the actual load sequence is required to apply these methods. Over the last 70 years, many nonlinear DAHs have been published. A comprehensive summary of nonlinear DAHs was published by Fatemi and Yang (Ref. 15) and extended by Hectors and De Waele (Ref. 16).
The objective of this paper is to review the use of nonlinear DAHs for gear fatigue. Currently, nonlinear DAHs are not commonly used for gears and there are no reliable publications about the suitability of nonlinear DAHs for gear fatigue. Therefore, this paper starts investigating the use of nonlinear DAHs for gears and compares the results with the linear approach according to Palmgren (Ref. 3) and Miner (Ref. 4). As mentioned, there are a lot of nonlinear DAHs and all of them differ more or less. One of the oldest and most widely referred methods is the DAH according to Subramanyan (Ref. 10).
The theory according to Subramanyan (Ref. 10) is based on the S/N curve as input to describe the load-carrying capacity. The calculation of the damage sum must be done sequentially for every group of load cycles at the same load level. The method does not require a separate calculation for every load cycle, instead, a new calculation step is only required if the load changes. This leads to a method that usually does not consume much computing power and is possible by hand. The DAH according to Subramanyan (Ref. 10) only requires the load sequence in addition to the input required for the method according to Palmgren (Ref. 3) and Miner (Ref. 4). This is not the case for many other nonlinear DAHs. Usually, nonlinear DAHs require additional information describing the behavior of the material and component under variable load (Ref. 16). To include this factor in the calculation, usually at least one additional coefficient is required. In most cases, this value cannot be derived directly and is not published within the theory therefore additional effort is necessary. Unfortunately, in many cases, a sufficient description of the procedure to determine this input value is not included in the publication. Therefore, this paper utilizes the DAH according to Subramanyan (Ref. 10) because it uses the same input as the linear approach and only requires the load sequence. Therefore, the two DAH approaches are the best comparable ones. Additionally, the DAH according to Subramanyan (Ref. 10) is the basis for other nonlinear DAHs such as the one according to Rege and Pavlou (Ref. 17), which is an example of an approach requiring additional input.
The damage sum D caused by the number of load cycles n to an undamaged component is calculated according to Subramanyan (Ref. 10) as follows:

(4)
where
D is the damage sum
ND is the number of load cycles at the knee point of the S/N curve
N is the number of allowable load cycles on the load level according to Equation 1
n is the number of load cycles of the current sequence
The calculation according to Equation 4 can only be applied directly for the first sequence of loads. To calculate the damage sum Dnext after the next amount of load cycles nnext, the current damage sum Dinitial has to be transferred from the past load level Linitial to the upcoming load level Lnext first. This is done by calculating the number of transfer load cycles ntransfer according to Equation 5.

(5)
where
ntransfer is the equivalent number of load cycles transferred to the next load level
ND is the number of load cycles at the knee point of the S/N curve
Nnext is the number of allowable load cycles on the next load level according to Equation 1
Dinitial is the initial damage sum
To apply Equation 4 to calculate the damage sum Dnext, the next amount of load cycles nnext has to be added to the number of transfer load cycles ntransfer. The resulting number of load cycles n can be inserted into the calculation and yields Equation 6.

(6)
where
Dnext is the damage sum after the next amount of load cycles
ND is the number of load cycles at the knee point of the S/N-curve
Nnext is the number of allowable load cycles on the next load level according to Equation 1
nnext is the next amount of load cycles
ntransfer is the equivalent number of load cycles transferred to the next load level
This sequence of calculation steps has to be repeated for every set of load cycles.
Influence of the Load Sequence on the Service Life of Gears
Whether the load sequence has influence on the service life of gears cannot be answered with a simple yes or no. At the moment, international standards (Refs. 5, 6) do not recommend taking the load sequence into account when calculating the expected service life of gears under variable load. As mentioned before, both ISO 6336-6:2019 (Ref. 5) and ANSI/AGMA 2101-D04 (Ref. 6) do not include a nonlinear method for damage accumulation. But it is important to point out that the standards do not make any statement about a possible load sequence influence. Usually it is uncommon to include considerations about the load sequence into the design process because the load sequence is unknown in advance. For the sake of completeness, it is mentioned, that there are cases where the load sequence is known at least to a certain degree. For example, in aviation, there are considerations regarding the load sequence within one single flight (Ref. 12). On the other hand, in cases of calculating or estimating the remaining service life of gears or other machine elements, the load sequence can potentially be included into the process and therefore may result in a more accurate result. A concept for such a method is presented by the authors in (Ref. 11).
There are several publications about the influence of the load sequence on the service life. Unfortunately, most of these publications do not focus on gears, instead tensile specimens are typically used. A potential impact of the load sequence on the service life can be linked partially to the residual stresses within the machine element (Ref. 12). Gears are usually heat-treated and, in many cases, shot-blasted. Both processes result in residual stress and therefore results obtained with specimens without a similar treatment cannot be transferred to gears. The process of gear failure and the related growth of damage are usually analyzed separately for every damage mechanism. For the damage mechanisms of pitting and tooth root breakage, an interaction is very unlikely, especially at the beginning of the damage development. Therefore, the damage mechanisms are considered independent of each other in international standards (Refs. 18–20) and in most of the research, including in this paper. For experimental investigations on gears, it is common to use a gear design, which usually only fails due to one specified failure mode. A brief overview of publications about the influence of the load sequence on gears is presented below. This paper focuses on the damage mechanism of tooth root breakage. Because of its scope, only publications and results regarding this failure mode are summarized. This summary and the whole paper are limited to gears manufactured out of gear-typical steel, such as 18CrNiMo7-6 or 16MnCr5. Because materials such as aluminum, carbon, or plastic may show a different behavior regarding damage growth and failure, these materials are not included.
Within his research, Suchandt (Refs. 21, 22) investigated the existence of an endurance limit for gears regarding tooth root breakage. For the case of nonvariable load, gears usually have, like mentioned before, a pronounced endurance limit. This may not be the case for variable load scenarios, because pre-damaged gears may have a reduced endurance limit due to the already occurred loads above the original endurance limit. The investigations focused on gears with an initial crack in the tooth root. These gears were then used to determine an endurance limit. Suchandt’s (Refs. 21, 22) investigations showed that the endurance limit decreased by 40 percent compared to the original one for the pre-damaged gears. Therefore, he concluded that it is possible to consider loads below 50 percent of the original endurance limit as nondamaging throughout the whole service life. This finding points out why the neglect of the load sequence can pose a potential issue. Stahl (Ref. 9) also showed in his research that different load sequences have an impact on the service life of gears regarding tooth root breakage. He showed that random load sequences result in a decreased service life compared to an ordered block sequence. In his experimental investigations, a significant reduction of the service life occurred for load sequences with shorter subsections compared to load sequences with relatively longer subsections. He also investigated the influence of an overload on the service life. An overload had more impact on reducing the service life, if applied early compared to one applied later in the load sequence.
Theoretical Comparison of Palmgren/Miner and Subramanyan
Damage Levels and Limitations
Like the DAH according to Palmgren (Ref. 3) and Miner (Ref. 4), the DAH according to Subramanyan (Ref. 10) does not require any additional inputs besides the S/N curve and the load sequence. This makes both approaches suitable for a direct comparison. At the beginning, a graphic comparison of the trend of different damage sums within the S/N diagram will be conducted.
In both theories, the S/N curve describes the moment of predicted failure and, therefore is equivalent to a damage sum of one. Figure 4 shows different damage sums and their locations as functions within the S/N diagram for the DAH according to Palmgren (Ref. 3) and Miner (Ref. 4). Due to the linearity of the theory, all the damage levels are parallel to each other. All the presented damage lines and S/N curves are linked to a probability of failure of 50 percent. In this context, it is important to mention that the standard deviation of the failure of gears due to tooth root breakage depends on the load. This was shown and described by Stahl (Ref. 23).
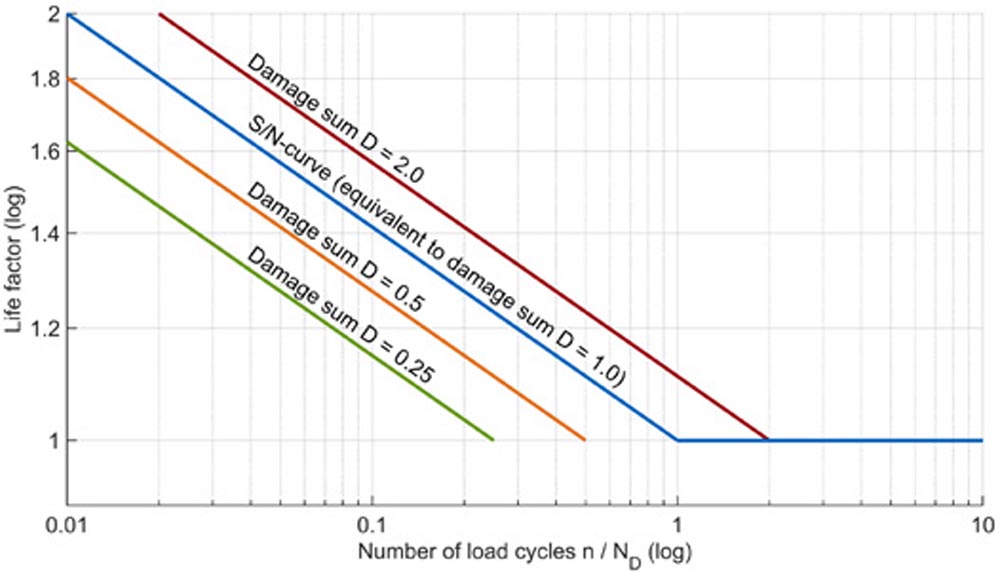
Figure 4—Different damage levels according to Palmgren/Miner in the S/N diagram.
Figure 5 shows the same damage sums and their locations as function within the S/N diagram for the DAH according to Subramanyan (Ref. 10).
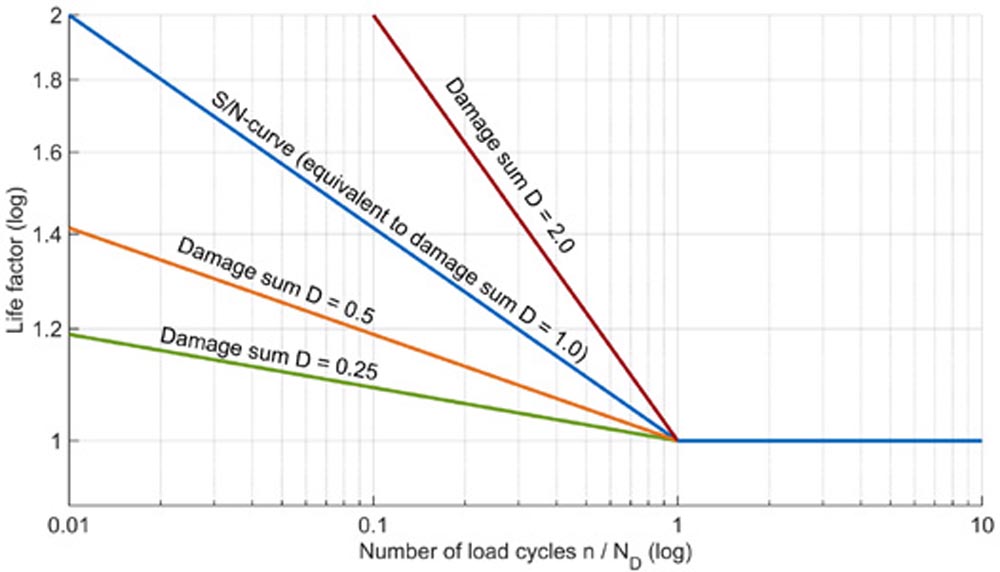
Figure 5—Different damage levels according to Subramanyan in the S/N diagram.
The damage levels for the DAH according to Subramanyan (Ref. 10) are not parallel within the S/N diagram. This is due to the nonlinear approach and therefore the sequence of loads has an impact on the resulting damage sum.
The DAH according to Subramanyan (Ref. 10) has some major limitations:
- Loads lower than the endurance limit cannot be integrated into the calculation. Therefore, these loads must be excluded similar to the DAH “Original Miner.” Since all damage levels have their origin in the knee point of the S/N curve, it is not possible to integrate loads lower than the endurance limit similar to the DAHs “Elementary Miner” and “Miner-Haibach.”
- As presented in Figure 5, all damage levels originate at the knee point of the S/N curve and become steeper as damage increases. Due to this fact, it is not possible to have a number of load cycles n larger than the number of load cycles at the knee point of the S/N curve ND. This would cause the damage sum to become negative and is therefore illogical. This issue can be retraced when looking at Equation 4. Especially when the scattering of the service life of input data is quite high, this can cause an issue.
- According to the original publication (Ref. 10), the method is not suitable for loads slightly above the endurance limit and for very high loads. This is due to the course of the damage lines. Unfortunately, there is no reliable statement about the range of loads, which should be avoided when calculating with this DAH.
Due to the mentioned limitations of the DAH according to Subramanyan (Ref. 10) the range of load and number of load cycles the DAH can be applied for is limited. Figure 6 shows the usable areas within the S/N diagram in white. The red areas within the figure are not mathematically valid and the yellow area represents the issue with loads slightly above the endurance limit and with high loads. Because there are no concrete limits for the load given in the literature, the limits were set at a life factor of 1.1 and 1.6 by the authors for this paper. The upper limit was chosen in a way that the corresponding load is sufficiently below the typical range of the static strength of the gear. This is to ensure that the load still results in a service life and does not lead to immediate failure. The lower limit is chosen at 1.1 to ensure a minimal distance to the endurance limit while maintaining a wide load range to apply the DAH according to Subramanyan (Ref. 10).
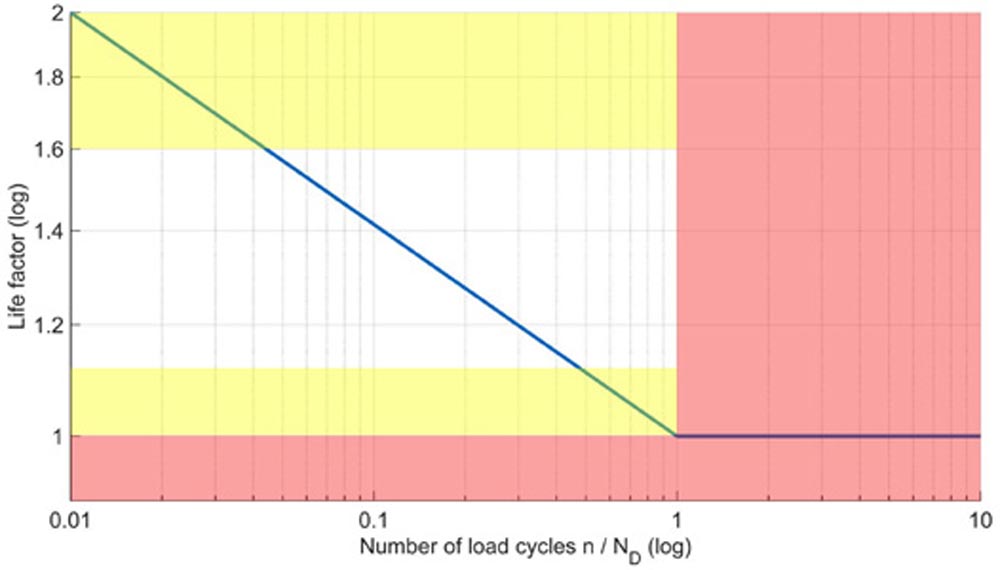
Figure 6—S/N diagram with limitations of the DAH according to Subramanyan (Ref. 10).
Impact of the Nonlinear Calculation
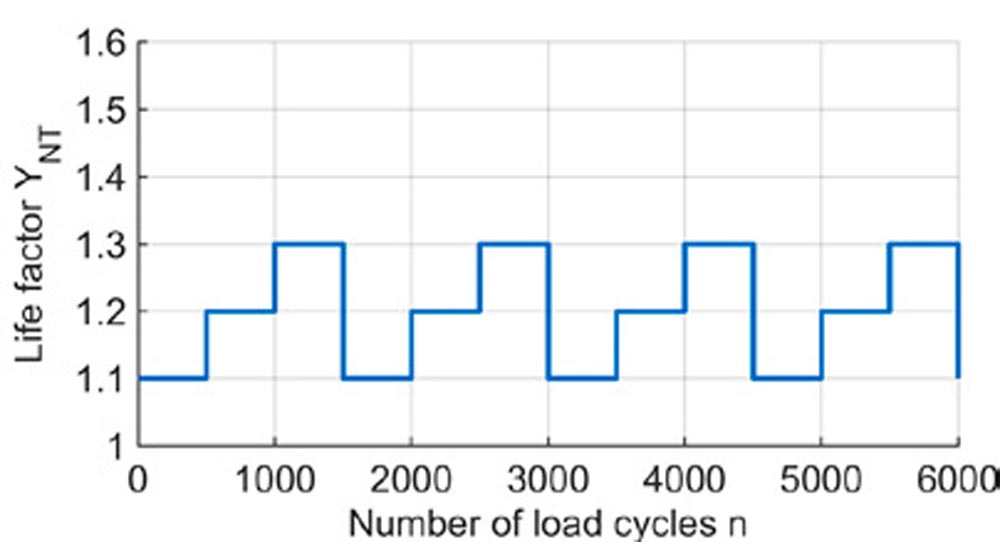
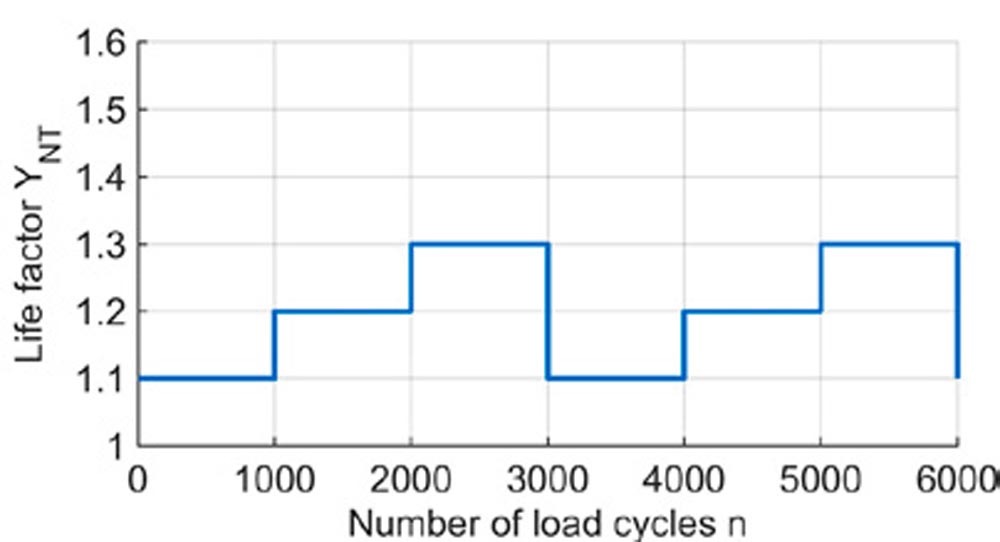
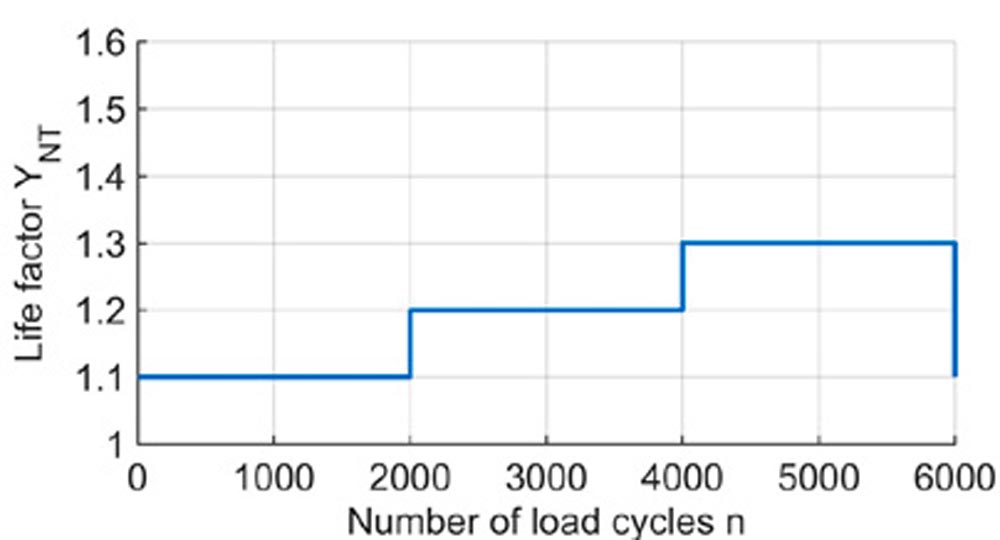
The nonlinear approach changes the results of the damage accumulation and therefore a different damage sum can be expected when comparing it to the linear approach according to Palmgren (Ref. 3) and Miner (Ref. 4). Table 1 shows a comparison of the resulting damage sum according to the DAH “Original Miner” and the DAH “Subramanyan” for three different load sequences. All these load sequences are designed to result in the same damage sum according to the linear approach. The difference between the three sequences is the intensity of the load mixing. This comparison is not designed to determine which of the theories is better suited for gears. Rather, the objective is to show the differences resulting from the various formulae.
The results presented in Table 1 (located at the top of page 44) show two trends:
- The DAH according to Subramanyan (Ref. 10) results in much higher damage sums compared to the DAH according to Miner (Ref. 4). The increase is between 106 percent and 118 percent.
- According to the DAH “Subramanyan” a load sequence is increasingly damaging with increasing load mixing. The difference in this case is up to 5.5 percent.
The influence of the different intensities of load mixing is within a realistic range. The general differences in the resulting damage sums are very high and unexpected. To understand the impact of the calculation, Figure 7 compares the development of the damage sum with an increasing number of runs of the load sequence with high load mixing, as presented in Table 1.
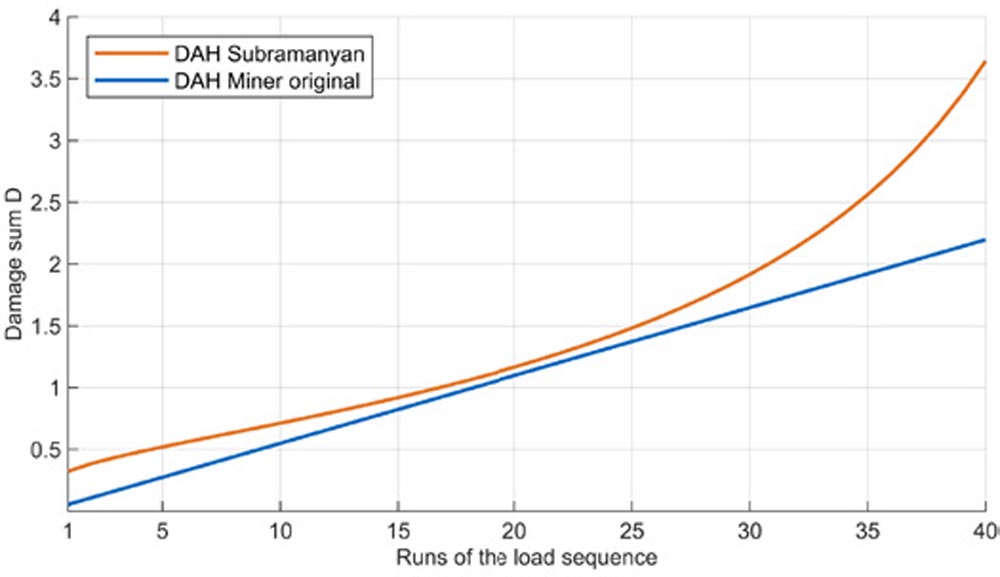
Figure 7—Comparison of the damage development.
Load sequence |
Damage sum according to DAH “Original Miner” |
Damage sum according to DAH “Subramanyan” |
High load mixing | ||
 |
0.2197 |
0.4791 |
Moderate load mixing | ||
|
0.2197 |
0.4699 |
Low load mixing | ||
|
0.2197 |
0.4530 |
The results presented in Figure 7 show that the difference in the damage sum between the two DAHs first decreases with increasing runs of the load sequence and then increases again for damage sums greater than about 1.3. In the range around a damage sum of 1, the two DAHs are quite close. Therefore, it can be assumed that both DAHs can be expected to predict failure with a reasonable difference. Based on this theoretical comparison, it is not possible to determine which of the two is more suitable for gear fatigue. Therefore, a comparison with the experimental data is necessary.
Experimental Study
Setup and S/N Curve
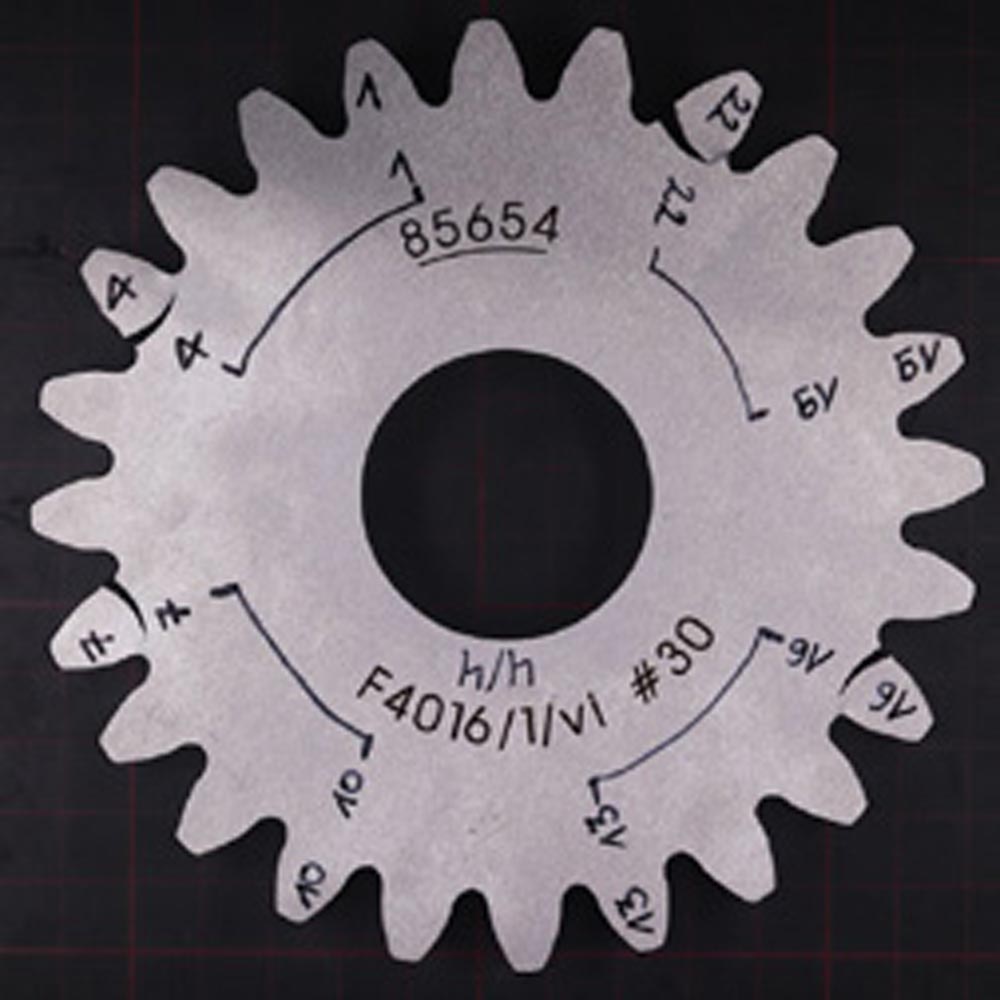
To compare the suitability of different DAHs for the prediction of the service life of gears under variable load, a dataset of fatigue tests with variable load sequences is required. For the tests, a pulsator test rig was used at the FZG. This test rig enables a time-efficient test procedure that allows an extensive data set to be realized. Figure 8 shows the test rig used. For the tests, a special gear design was applied, which is optimized for this kind of test and has already been used in several research projects at the FZG. Information about the gear is presented in Table 2.
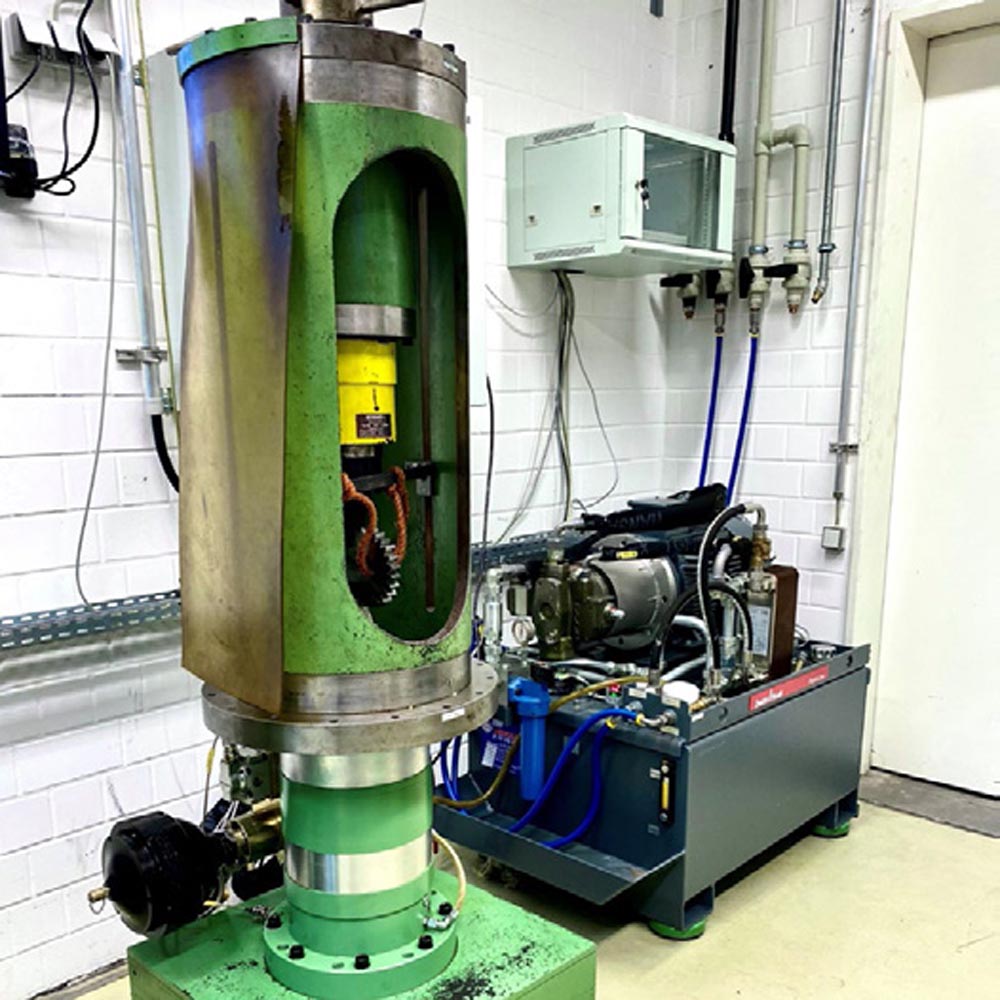
Figure 8—Test rig.
Gear |
Spur Gear |
 |
Normal Modual |
5 mm | |
Number of teeth |
24 | |
Face width |
20 mm | |
Machining |
Milling and grinding | |
Material |
Steel 18CrNiMo7-6 | |
Heat treatment |
Case-hardened |
Table 2—Gear data and picture of tested gear with four datapoints.
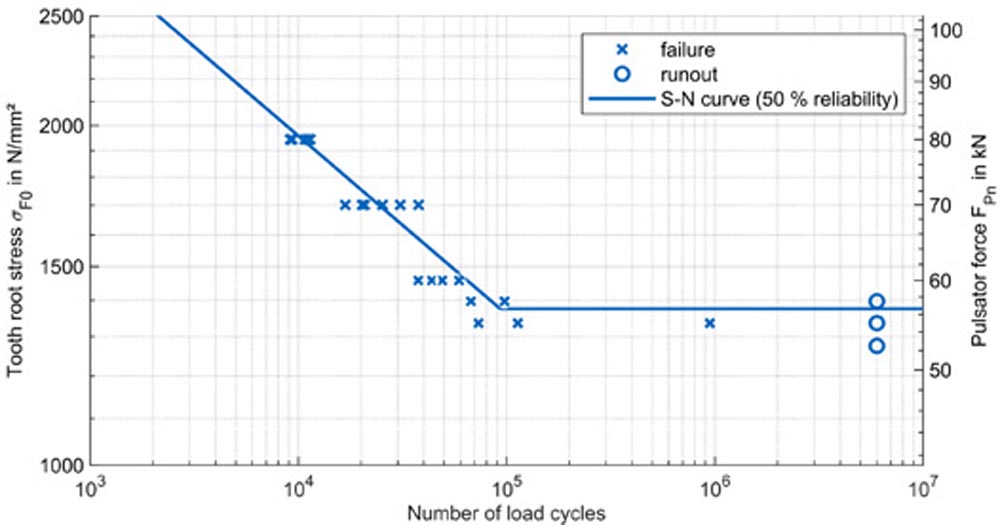
Figure 9—S/N curve of the tested gear.
To enable a calculation according to the DAHs “Original Miner” and “Subramanyan” a S/N curve is required. The S/N curve was determined following the procedure described by Tobie (Ref. 13) and is shown in Figure 9. The limit of load cycles, at which a test was declared a runout, was set at six million.
Tooth Root Breakage Tests with Variable Load
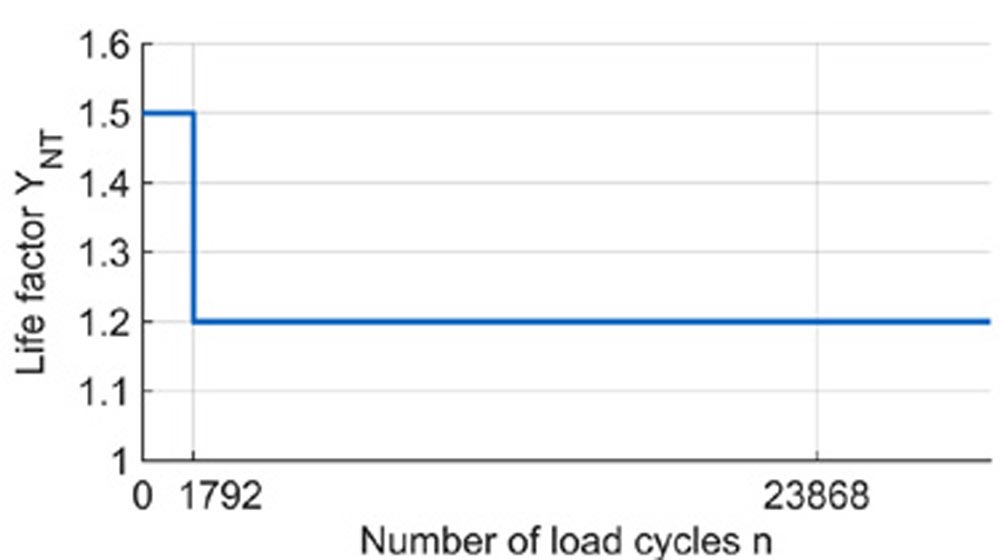
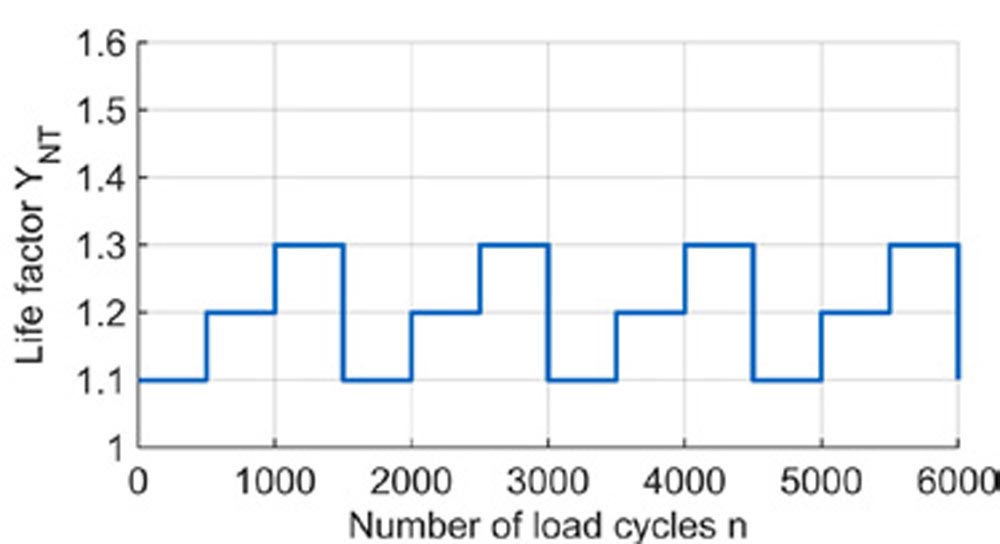
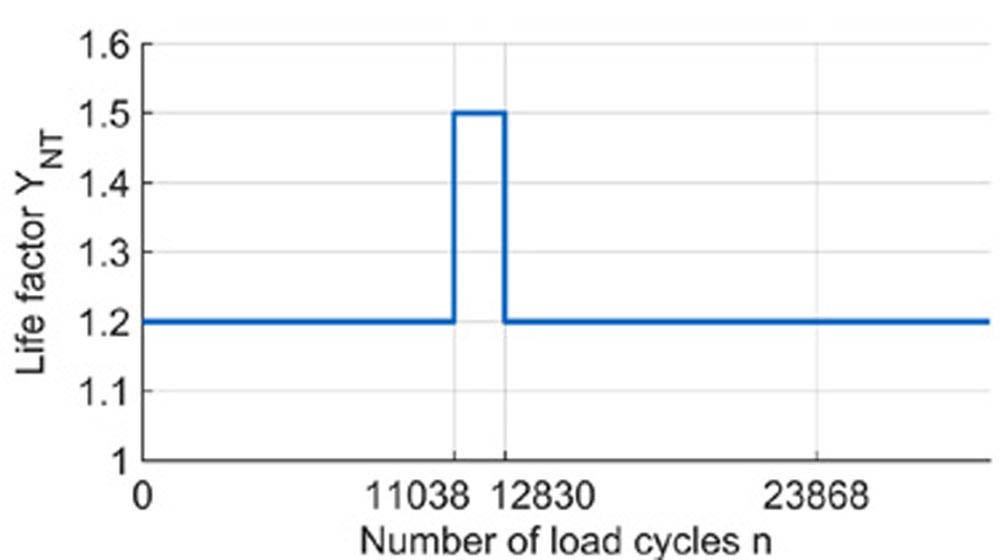
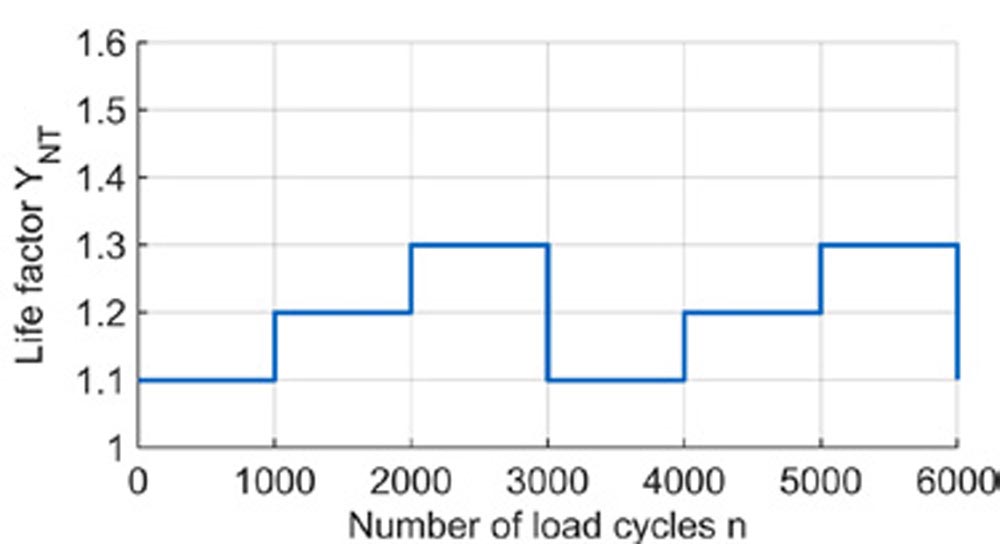
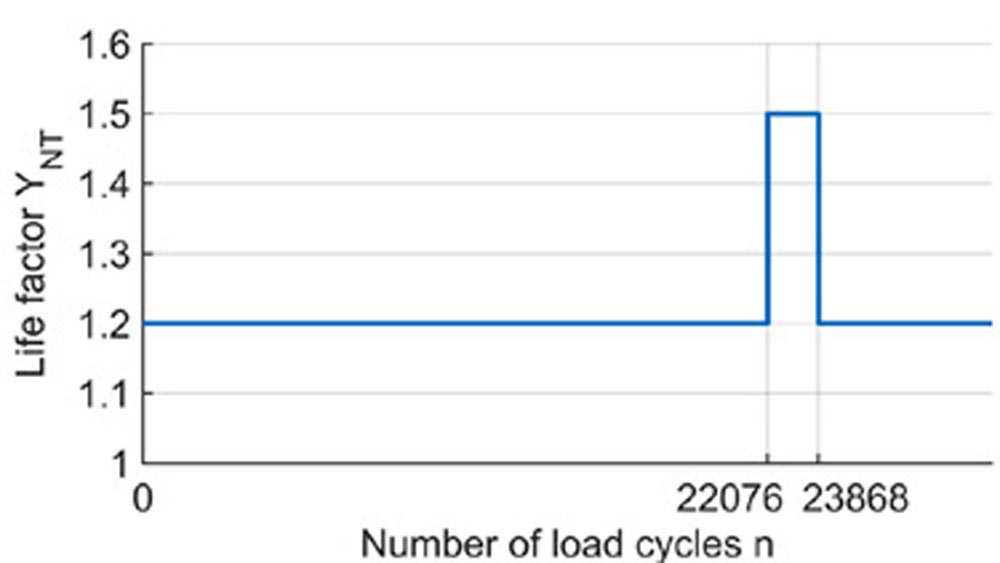
To compare different DAHs for their suitability for the fatigue of gears, a dataset with service life information under variable load is required. For this test series, the same test rig and the same gears as presented in the section “Setup and S/N Curve” were used. Two different types of variable loads were investigated with three assorted characteristics. The six different load sequences are presented in Table 3.
Influence of overload timing |
Influence of load mixing |
Early life overload |
High load mixing |
 |
 |
Midlife overload |
Moderate load mixing |
 |
 |
Late life overload |
Low load mixing |
 |
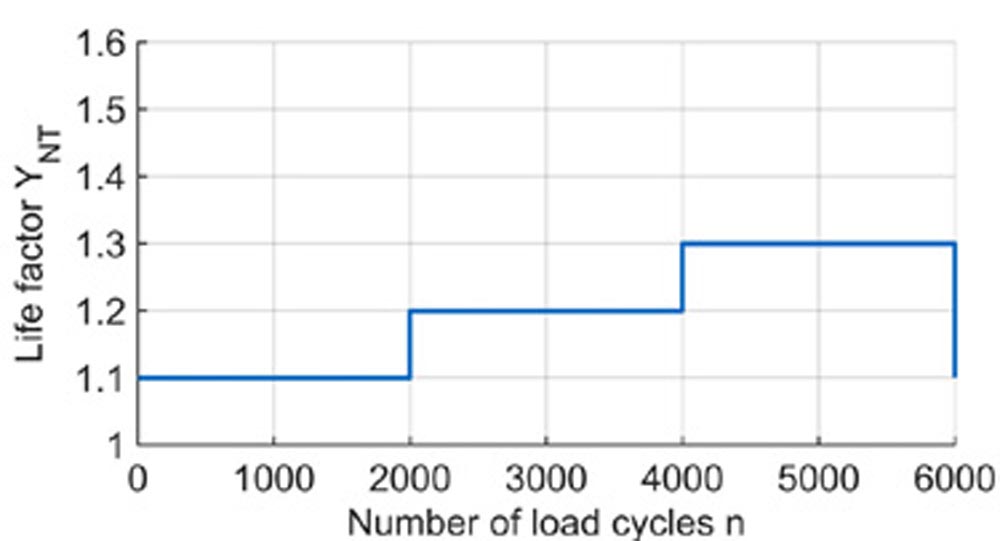 |
Table 3—Applied load sequences.
The load sequences regarding the influence of the load mixing are like the ones used in the section “Theoretical Comparison of Palmgren/Miner and Subramanyan” for the theoretical comparison. For the tests, the sequence is repeated until the gear fails due to a breakage of one tooth. The test was conducted ten times for each of the three load sequences.
To test the influence of the timing of a high load or overload, three different load sequences were designed. Reference for the sequences is the damage sum according to the DAH “Original Miner.” The length of the high load is chosen in a way to account for a damage sum of 0.25. The position within the sequence is chosen as follows:
- Early-life overload: The load sequence starts with the overload.
- Midlife overload: The overload is positioned in a way that it is in the middle of the theoretical service life according to the Miner hypotheses (Ref. 4), which would end at a damage sum of one.
- Late-life overload: The overload is positioned in a way that it is at the end of the theoretical service life according to the Miner hypotheses (Ref. 4), which would end at a damage sum of one.
If a gear has not failed at the end of the sequence, the test ends with a constant load until the gear fails. The sequence is not repeated and therefore the overload only occurs once. As for the influence of the load mixing, the test was conducted ten times for each of the three load sequences.
Results and Comparison
In this section, the results of the experimental investigations are presented and analyzed according to the DAHs “Original Miner” and “Subramanyan.” Because all of the loads applied in the test are higher than the endurance limit of the gears, the DAH “Original Miner” is equivalent to the DAHs “Elementary Miner” and “Miner-Haibach.” For the comparison, the recorded load sequence of every test run was converted to the damage sum corresponding to the moment of failure, using the methods presented within sections “Linear Damage Accumulation Hypotheses” and “Nonlinear Damage Accumulation Hypotheses” and the S/N curve shown in Figure 9.
The comparison of the two DAHs is based on their suitability to account for the differences in service life caused by the load sequence. The impact of the load sequence on the service life can be derived from the results according to the DAH “Original Miner” because this DAH is linear and does not take the load sequence into account. In the next step, these results are compared to a similar evaluation of the data according to the DAH “Subramanyan.” If the deviations between the results for the three different load sequences are smaller than the ones according to the DAH “Original Miner,” the nonlinear approach can account for the influence of the load sequence to a certain degree and is, therefore, more suitable for gears. On the other hand, if the deviations increase or are comparable, the approach is less suitable for gears or equally suitable but more complex.
Influence of Load Mixing
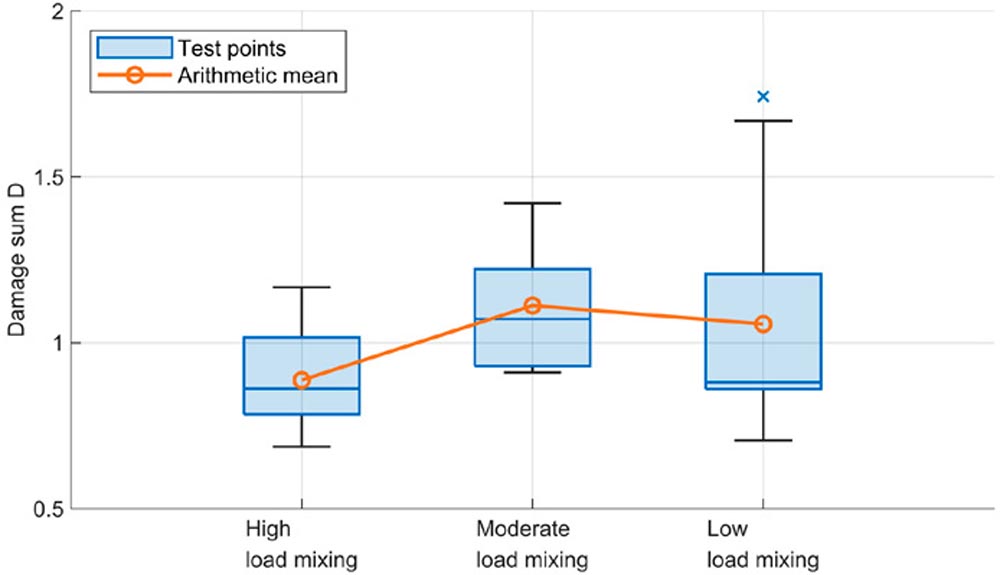
The results of the test series investigating the influence of the load mixing are presented in Table 4. The data is analyzed with the DAHs “Original Miner” and “Subramanyan” and is displayed as boxplots.
Results according to DAH “Original Miner” |
 |
Results according to DAH “Subramanyan” |
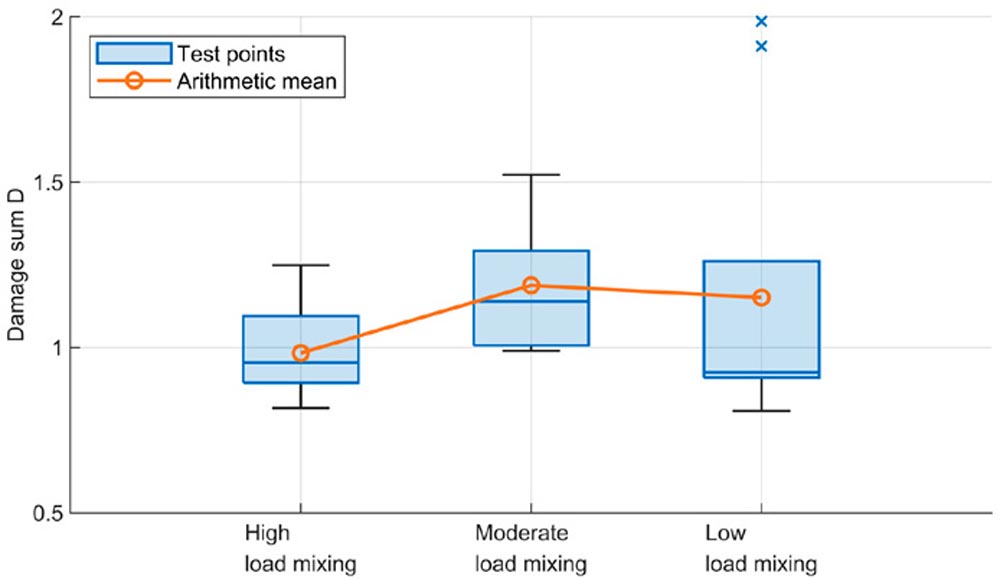 |
Table 4—Results of the test series regarding the load mixing.
The results indicate that load mixing influences the service life of gears. When looking at the damage sum according to “Original Miner” the service life of gears is significantly decreased in the case of high load mixing. Moderate and low load mixing results in similar mean values, but the scattering of test points is significantly higher with low load mixing. These observations correspond to the results according to Stahl (Ref. 9). A high number of load changes results in a significant reduction of the service life.
When comparing both DAHs, the results show similar trends. In general, the DAH according to Subramanyan (Ref. 10) results in higher damage sums than the DAH “Original Miner”. The scattering of the damage sums within the data points of one load sequence differs for both DAHs. This can be explained by the nonlinear growth of the damage sum when applying the DAH “Subramanyan” (compare Figure 7). These observations are consistent with the theoretical comparison in the section “Theoretical Comparison of Palmgren/Miner and Subramanyan.” The deviations between the calculated service life of the three load sequences are very similar, especially for a qualitative comparison. For this reason, the DAH “Subramanyan” does not provide any added value over the DAH “Original Miner” in this case.
Influence of Overload Timing
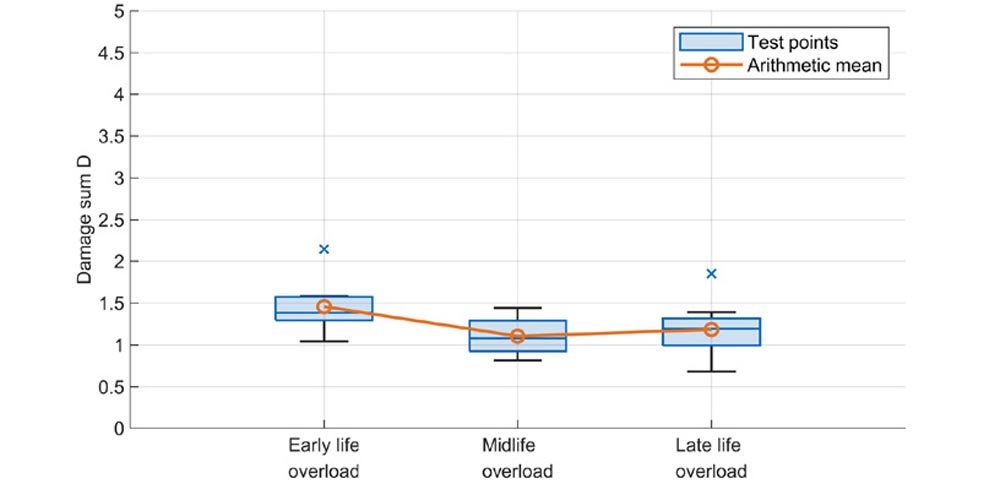
The results of the test series investigating the influence of the overload timing are presented in Table 5. The data is analyzed with the DAHs “Original Miner” and “Subramanyan” and displayed as boxplots.
Results according to DAH “Original Miner” |
 |
Results according to DAH “Subramanyan” |
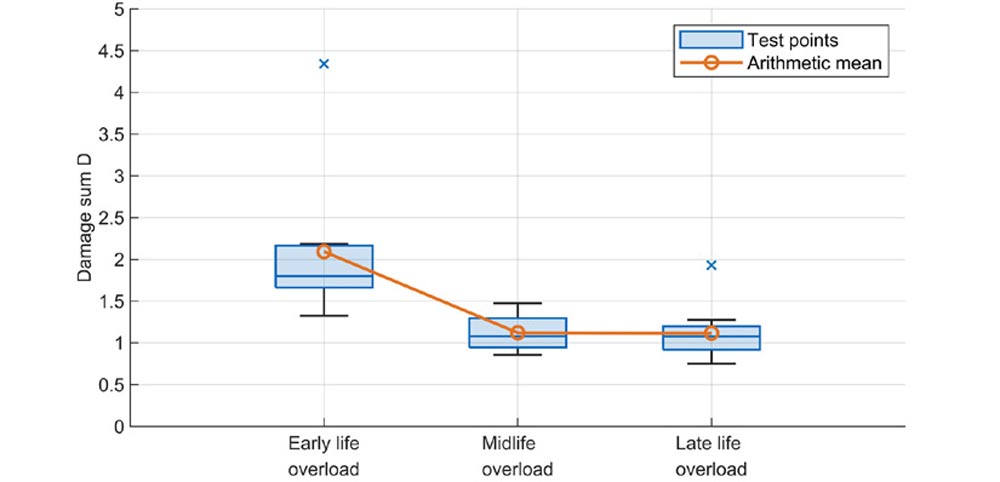 |
Table 5—Results of the test series regarding the overload timing.
The results of the overload timing test series also indicate there is an influence of the load sequence on the service life of the gears. The load sequence starting with the overload results in much higher damage sums at failure compared to the other two load sequences. This is the case for both used DAHs. The average damage sum according to the DAH “Original Miner” for the early overload is 32 percent higher compared to the midlife overload and 23 percent higher compared to the late-life overload. These results show a reversed trend to the observations according to Stahl (Ref. 9). Stahl (Ref. 9) showed in his research that an overload results in a higher reduction of the service life if applied early compared to an occurrence later in the load sequence.
Comparing the results of both DAHs the same trend for increased damage sums for the DAH “Subramanyan” can be observed. The DAH according to Subramanyan (Ref. 10) also calculates higher damage sums for early life overload. The deviation of the average damage sum for the early overload compared to the other two load sequences is 87 percent in both cases. These results show that the DAH according to “Subramanyan” can account for the differences in service life between midlife and late-life overload better than the DAH according to Miner. However, the deviation between the early life overload and the other two load sequences is greatly increased, therefore the DAH performs worse with this difference. This can be explained by the theory behind the DAH according to Subramanyan (Ref. 10). The formulae of the hypothesis are designed in a way that load sequences starting with a high load and ending with a low load result in an increased damage sum compared to sequences starting with low load and ending with high load (Refs. 10, 15, 16). Expressed in a different way, load sequences starting with a high load and ending with a low load result in a decreased service life compared to sequences starting with low load and ending with high load. This assumption contradicts the presented results for the different overload sequences. For this particular case, the results show that a high load decreases the service life least if the high load is applied right at the beginning of the service life. Therefore, the use of the DAH according to Subramanyan (Ref. 10) does not result in a decreased difference in the resulting damage sums; instead, it increases the difference even more. In conclusion, the DAH according to Subramanyan (Ref. 10) results in a decreased accuracy compared to the DAH according to Palmgren (Ref. 3) and Miner (Ref. 4).
Conclusion and Outlook
Conclusion
The presented experimental results indicate that the load sequence influences the service life of gears regarding the failure mode tooth root breakage. The two series of tests regarding load mixing and overload timing showed differences in average service life:
High load mixing resulted in a significant decrease in the service life compared to moderate and low load mixing. Moderate and low load mixing resulted in comparable average service lives, but the scattering was significantly increased in the case of low load mixing.
A significant influence on the service life of gears could be observed regarding the timing of a high load or an overload. In the presented test series, the case of an early life overload resulted in a significantly higher service life compared to the mid and end-life overload.
These trends correlate only partially with previous research according to Stahl (Ref. 9). The results for the influence of the load mixing show good accordance. The results for the influence of the overload timing contradict each other. At the moment, there is no conclusive explanation for this and it has to be addressed further in upcoming research.
The shown differences in service life caused by different load sequences cannot be accounted for with linear DAHs and therefore the nonlinear DAH according to Subramanyan (Ref. 10) was applied in this paper to investigate if it yields any potential benefit. For the presented data, Subramanyan’s nonlinear DAH (Ref. 10) showed no increased accuracy compared to the approach according to Palmgren (Ref. 3) and Miner (Ref. 4). For the influence of load mixing and overload timing, both approaches nearly showed the same trends. Therefore, no improvement of the service life calculation is to be expected by using the more complex nonlinear DAH according to Subramanyan (Ref. 10) for this particular case. At the same time, the DAH according to Subramanyan (Ref. 10) has more limitations compared to the linear approach according to Palmgren (Ref. 3) and Miner (Ref. 4). This results in a decreased general validity of the nonlinear DAH. Therefore, the results of this paper lead to the conclusion that the general recommendation to apply a linear approach to damage accumulation is valid for the presented data and there is no motivation to apply the more complex approach according to Subramanyan (Ref. 10).
Outlook
In this paper, a first analysis of the data using only one nonlinear DAH was presented. As stated, no advantage of the use of this approach could be derived from this. The DAH according to Subramanyan (Ref. 10) is only one of many nonlinear DAHs published today. Therefore, the next step will be the investigation of more nonlinear DAH in a similar manner. At first, the DAHs will be analyzed theoretically to determine their suitability for the use case of gears. A systematic comparison of the DAH is planned to determine the most promising methods. In the upcoming steps, the presented experimental data will be assessed with the chosen nonlinear approaches. This does not require any additional experimental investigations because the presented dataset now exists. The objective of further research is to investigate promising and widely published DAH approaches to establish their suitability for gears. Additionally, the influence of the load sequence on the service life of gears has to be investigated further. As presented contradictions with other research appeared and have to be clarified. In the end, it may be possible to detect a DAH, which enables a more accurate service life prediction compared to the nearly 100-year-old approach according to Palmgren (Ref. 3) and Miner (Ref. 4).
Funding
The presented results are based on the research project STA 1198/19-1; supported by the German Research Foundation e.V. (DFG). The authors would like to thank for the sponsorship and support received from the DFG.

References
- Krankenhagen, G.: “Material testing not only technologically (In German: Werkstoffprüfung mal nicht nur technologisch)”, Kultur & Technik, vol. 2, no. 1, pp. 46–51, 1978.
- Wöhler, A.: “Report on the experiments carried out on the Royal Lower Silesian-Mark Railway with devices for measuring the bending and twisting of railroad car axles during travel (In German: Bericht über die Versuche, welche auf der Königl. Niederschlesisch-Märkischen Eisenbahn mit Apparaten zum Messen der Biegung und Verdrehung von Eisenbahnwagen-Achsen während der Fahrt angestellt wurden)”, Zeitschrift für Bauwesen, 1858.
- Pålmgren, A.: “Service life of ball gearings (In German: Die Lebensdauer von Kugellager)”, Zeitschrift des Vereines Deutscher Ingenieure, 58(14), pp. 339–341, 1924.
- Miner, M. A.: Cumulative Damage in Fatigue, Journal of Applied Mechanics, vol. 12, no. 3, pp. 159–164, 1945.
- ISO 6336-6:2019-11: Calculation of load capacity of spur and helical gears — Part 6: Calculation of service life under variable load, ISO, Berlin, 2019.
- ANSI/AGMA 2101-D04: Fundamental Rating Factors and Calculation Methods for Involute Spur and Helical Gear Teeth, 2004.
- Hein, M.: “Holistic approach for fatigue life design and testing of gearwheels (In German: Zur ganzheitlichen betriebsfesten Auslegung und Prüfung von Getriebezahnrädern)”. Ph.D. thesis, Technical University of Munich, 2018.
- Eberspächer, C.; Höhn, B.-R.; Winter, H.: “IGF Nr. 8490, FVA-Nr. 125/III - Booklet 457 - Gear surface serive life (final report) (In German: Zahnflankenlebensdauer Abschlussbericht - Untersuchungen zur nicht-linearen Schädigung bei der Grüchenbildung an Zahnflanken)”. Research Association for Drive Technology (FVA). Frankfurt, 1995.
- Stahl, K.; Oster, P.; Höhn, B.-R.; Winter, H.: “IGF Nr. 9889, FVA-Nr. 188/II - Booklet 502 - Toothroot fatigue life (final report) (In German: Zahnfuß-Betriebsfestigkeit Abschlussbericht - Zahnfußbetriebsfestigkeitsuntersuchungen an einsatzgehärteten Zahnrädern)”. Research Association for Drive Technology (FVA). Frankfurt, 1996.
- Subramanyan, S.: A Cumulative Damage Rule Based on the Knee Point of the S-N Curve, J. Eng. Mater. Technol, vol. 98, no. 4, pp. 316–321, 1976, DOI: 10.1115/1.3443383.
- Vietze, D.; Hein, M.; Stahl, K.: Method for a cloud based remaining-service-life-prediction for vehicle-gearboxes based on big-data-analysis and machine learning, Engineering Research, no. 84, pp. 305–314, 2020, DOI: 10.1007/s10010-020-00415-0.
- Haibach, E.: “Operational strength - Methods and data for calculation” (In German: “Betriebsfestigkeit - Verfahren und Daten zur Bauteilberechnung)”, 3rd edition. Springer. Berlin, 2006.
- Tobie, T.; Matt, P.: FVA 563 I - FVA Guideline: “Recommendations for the standardization of load carrying capacity test of hardened and case-hardened spurgears (In German: Empfehlung zur Vereinheitlichung von Tragfähigkeitsversuchen an vergüteten und gehärteten Zylinderrädern)”. Research Association for Drive Technology (FVA). Frankfurt, 2012.
- Basquin, O.: The exponential law of endurance tests in Proceedings of the Thirteenth Annual Meeting, New Jersey, pp. 625–630, 1910.
- Fatemi A., Y. L.: Cumulative fatigue damage and life prediction theories- A survey of the state of the art for homogeneous materials, International Journal of Fatigue, no. 20, pp. 9–34, Jan. 1998, DOI: 10.1016/S0142-1123(97)00081-9.
- Hectors, K.; Waele, W. de: Cumulative Damage and Life Prediction Models for High-Cycle Fatigue of Metals: A Review, Metals, vol. 11, no. 2, 2021, DOI: 10.3390/met11020204.
- Rege, K.; Pavlou, D. G.: A one-parameter nonlinear fatigue damage accumulation model, International Journal of Fatigue, vol. 98, pp. 234–246, 2017, DOI: 10.1016/j.ijfatigue.2017.01.039.
- ISO 6336-1:2019-11: Calculation of load capacity of spur and helical gears — Part 1: Basic principles, introduction and general influence factors, ISO, Berlin, 2019.
- ISO 6336-2:2019-11: Calculation of load capacity of spur and helical gears — Part 2: Calculation of surface durability (pitting): Corrected version 2020-11, ISO, Berlin, 2019.
- ISO 6336-3:2019-11: Calculation of load capacity of spur and helical gears — Part 3: Calculation of tooth bending strength: Corrected version 2020-11, ISO, Berlin, 2019.
- Suchandt, T.: “Fatigue tests on the tooth root strength of case-hardened gears and the breaking strength of quenched and tempered plate chains (In German: Betriebsfestigkeitsuntersuchungen zur Zahnfußtragfähigfkeit einsatzgehärteter Zahnräder und zur Bruchfestigekit vergüteter Laschenketten)”. Ph.D. thesis, Technical University of Munich, 1993.
- Suchandt, T.; Oster, P.; Höhn, B.-R.; Winter, H.: “IGF Nr. 8387, FVA-Nr. 188/I - Booklet 408 - tooth root fatigue life analysis (final report) (In German: Zahnfuß-Betriebsfestigkeit Abschlussbericht - Zahnfuß-Betriebsfestigkeitsuntersuchungen an einsatzgehärten Zahnrädern)”. Research Association for Drive Technology (FVA). Frankfurt, 1993.
- Stahl, K.; Michaelis, K.; Höhn, B.-R.; Winter, H.: “IGF-Nr. 11154, FVA-Nr. 304 - Booklet 580 - Service Life Statistics (final report) (In German: Lebensdauerstatistik - Statistische Methoden zur Beurteilung von Bauteillebensdauer und Zuverlässigkeit und ihre beispielhafte Anwendung auf Zahnräder)”. Research Association for Drive Technology (FVA). Frankfurt, 1999.
Printed with permission of the copyright holder, the American Gear Manufacturers Association, 1001 N. Fairfax Street, 5th Floor, Alexandria, Virginia 22314. Statements presented in this paper are those of the authors and may not represent the position or opinion of the American Gear Manufacturers Association. |


