[advertisement]

November 1, 2014


The Gear Industry Surveys State of the Gear Industry Features

2014 State of the Gear Industry

2014 State of the Gear Industry

Reader Survey Results

Gear Technology's annual State-of-the-Gear-Industry survey polls gear manufacturers about the latest trends and opinions relating to the overall health of the gear industry.

As in years past, the survey was conducted anonymously, with invitations sent by e-mail to gear manufacturing companies around the world.

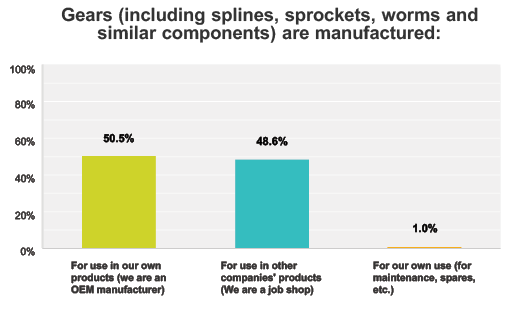
More than 300 individuals responded to the online survey, answering questions about their manufacturing operations and current challenges facing their businesses. All of the responses included in these results come from individuals who work at locations where gears, splines, sprockets, worms and similar products are manufactured. They work for gear manufacturing job shops, captive shops at OEMs and end user locations.

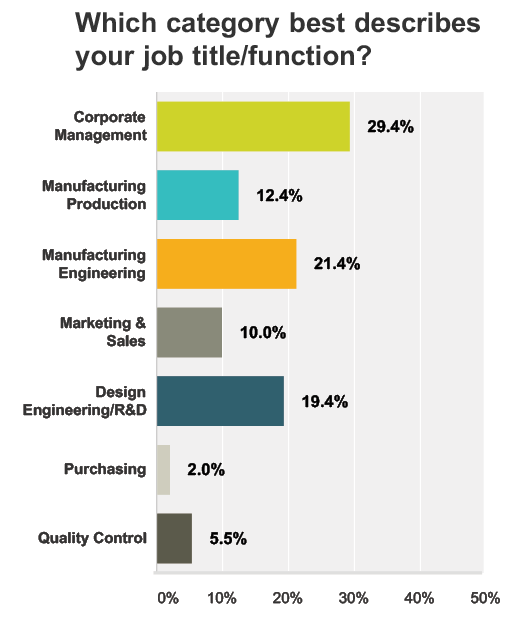
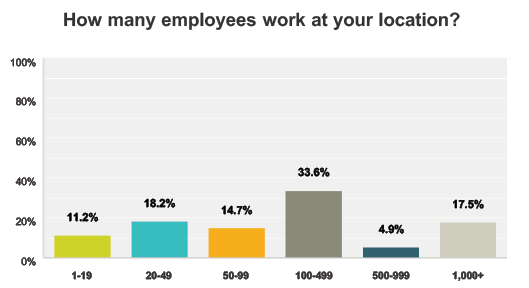
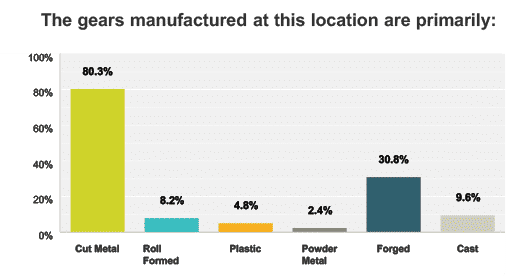
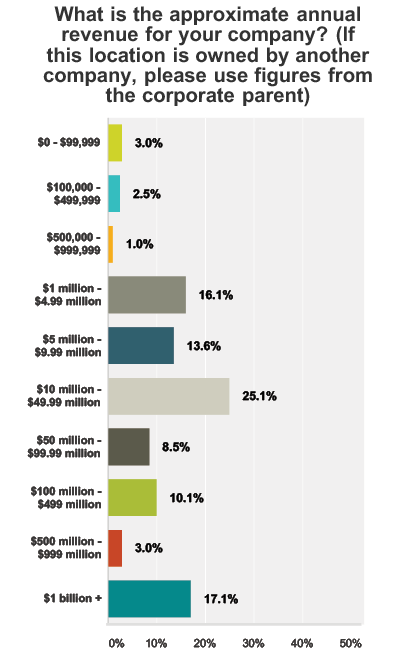
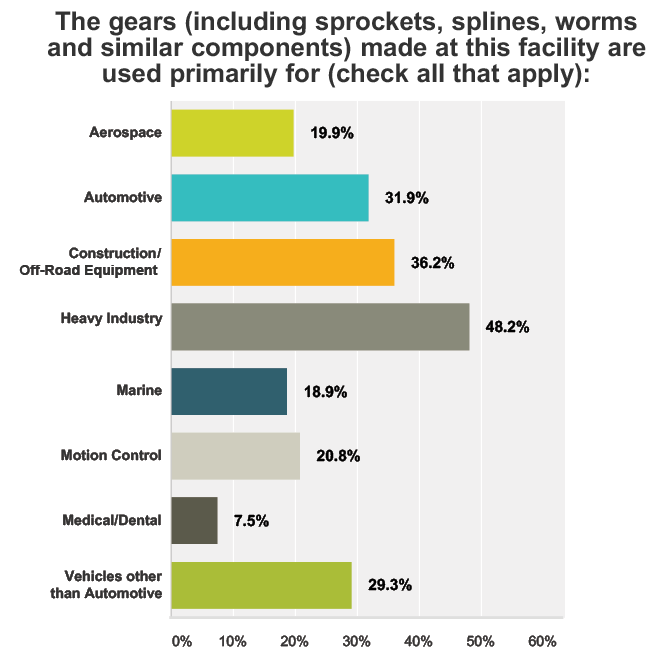
A full breakdown of respondent demographics can be found at the end of this article.

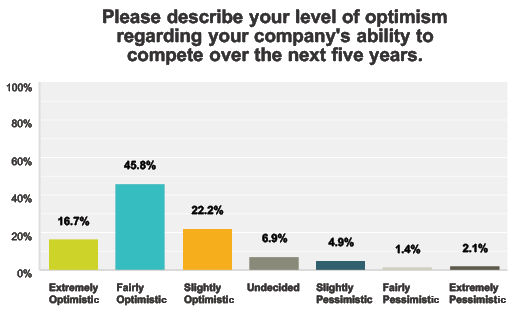
Gear Industry Optimism - Depends on Where You Are

Over the past nine years, approximately 89% of respondents indicated some level of optimism regarding their companies' ability to compete.

Share and save:


This article appeared in the November/December 2014 issue.


Read PDF

[advertisement]

This year trended slightly downward, with only about 85% indicating optimism. However, there was a wide disparity in optimism depending on where the respondent was from. Within North America, optimism ranked slightly higher than average, at 90%. Outside North America, optimism was decidedly lower, at 80%.

Significant Challenges

Across the board, our respondents indicated pressure to meet customer demands for higher quality, reduced lead times and new products, all while struggling to maintain engineering and skilled production capacity.

Significance of each challenge was rated from 1-10, with 10 being the most significant. Average weighted values are represented here.

  • "Improving quality and on time delivery ."
  • "Uncertainty of receiving planned orders."
  • "Fewer production people, more engineering capacity."
  • "Productivity and quality."
  • "New transmission implementation."
  • "Internal costs."
  • "To meet customers' increasing quality requirements."
  • "Market conditions."
  • "New product development."
  • "Skilled labor and rising energy taxes/costs."
  • "Implement aerospace mentality."
  • "Skill for new products."
  • "Meet growing demand, diversify into more products."
  • "Shorten lead times."
  • "Volume increase through new products."
  • "Engineering."
  • "Handling complexity."
  • "Technology upgrades and cost reductions."
  • "Create higher efficiency products, reduce development time to market, develop more modular products."
  • "Marketing to new customers."
  • "Develop new PM techniques."
  • "Justifying investment for new equipment. Determining payback thresholds."
  • "New investments in updated technologies."
  • "Reduce lead times."
  • "Increasing capacity and capability."
  • "Introduction of new processes."
  • "Quality control."
  • "Productivity."
  • "Increasing production while training new staff."
  • "Introducing two new gearbox lines."
  • Employment

    Gear industry employment was very stable in 2014, with 40% of respondents indicating no change in their company's number of employees, and nearly equal numbers reporting increased (32.4%) and decreased (27.6%) employment. However, gear industry respondents have a fairly positive outlook toward 2015, with 87.5% indicating they believe that employment levels will either remain the same or increase.

    Why Did Your Employment Level Increase?

    • " Expansion of manufacturing facility."
    • " Business picking up and new customers."
    • " Increase in volumes."
    • " Improved car sales require more automatic transmissions."
    • " Surge in demand and aftermarket parts."
    • " Business was slow in second quarter, but picked up in third and fourth quarters."
    • " Production demand increased."
    • " Large increase in new multi-year orders."
    • " Staff level was very low in 2013."
    • " Building for future growth."
    • " Increase in demand for natural gas fracking equipment."
    • " We were understaffed the previous year."
    • " Increased business from existing customers along with new business from new customers."

    Production Output

    Most gear manufacturers (71.7%) either maintained or grew their production output in 2014, while 28.3% indicated a decrease in output this year. But the future looks a little bit brighter, with only 15.5% expecting decreased production in 2015, and more than half (54.2%) expecting increased production levels next year.

    Sales Volume

    [advertisement]

    Gear manufacturers are even more optimistic with regards to sales volume than with employment or production levels. After a year that saw 42% of respondents experience increased sales, 55.8% are expecting an increase in sales for 2015.

    Skilled Labor

    The difficulty in finding and keeping skilled labor remains one of the most significant challenges facing the gear industry. According to our respondents, the issue confronts gear manufacturers throughout their organizations, with shop floor and engineering workers the most difficult areas to fill. Although the majority of respondents (58.7%) reported a shortage of skilled labor, this number is lower than last year. 66% reported a shortage of skilled labor in 2013.

    Capital Spending

    82% of respondents work at locations that spent more than $100,000 on capital equipment in 2014.

    43% work at locations that spend more than $1 million.

    26% of respondents' companies spent less than last year.

    38% of respondents' companies spent more.

    80% of respondents expect to spend the same as 2014 or more in 2015

    Demographics

    [advertisement]