σ: Process standard deviation quantifies the data dispersion from the average. A lower s indicates that the data points tend to be very close to the average, leading to improved process capability. In the absence of specialized software for SPC analysis, an approximation formula in MS Excel spreadsheet, "stdev" can be used. The sample size for evaluating the process capability is typically greater than 25.
6*σ: Statistical process variation — roughly 99.97% of the population will be within this range.
X̄: Average of the measured sample population.
Cp — Capability Index. Cp = (USL-LSL)/(6*σ). This index is a measure of a potential process capability — a ratio between the tolerance range and the process variation. Cp value, however, does not reveal how well the process is centered in relation to the tolerance range.
Cpk: Capability Index that takes the centering of the process into account.
For a bilateral tolerance one needs to determine CpkL and CpkU and pick the smaller of the two. Cpk: min {CpkU, CpkL}; CpkL = (USL - X̄)/(3*σ), CpkU = (X̄ - LSL)/(3*σ) (Fig.1). Cpk > 1 provides a statistical assurance that the process is not only capable, but is also well-centered within the tolerance limits. In the case of a bilateral tolerance, both Cp and Cpk indices provide important insights into the process capability assessment.

Figure 1 Cp and Cpk determination for a bi-lateral tolerance.
For a unilateral tolerance, however, only a Cpk is used for the process assessment, as Cp may have no meaning. For a unilateral tolerance, Cpk is calculated only for the USL: Cpk = (USL - X)/(3*s) (Fig. 2).

Figure 2 Cpk determination for a unilateral tolerance.
Capability indices (Cp and Cpk) greater than unity are a minimum requirement for a capable process. Most companies, however, use more stringent requirements; e.g. — Cp and Cpk must be greater than 1.33, 1.67, or even 2.
Common cause variations are random and inherent to the process; these variations come from contributors such as machine, cutting tool, fixture, blanks, set-up, etc. when the quality of each contributor is in conformance with its respective tolerance limits.
Assignable cause variations are non-random and are usually greater than those induced by common causes. An assignable cause variation is frequently induced by the same contributors as common causes; i.e. — machine, cutting tool, fixture, blanks, etc. — when they are damaged, worn out, or, for whatever reason, are outside of their respective tolerance limits. For the process to be in control, all assignable cause variations must be found and eliminated (Ref. 1).
Preparations and Limitations
Prior to measuring gears, it is important to attain a high confidence level in the inspection process to ensure that reliable data are analyzed. Whenever possible, the inspection fixture should use the same gear datum as the gear cutting fixture. Calibration of the inspection machine and a GR&R (gage repeatability and reproducibility review) should be conducted to determine if the inspection process is compatible with the gear tolerances.
It is also important to note that for extremely precise gear tolerances, when a GR&R results in a P/T (precision/tolerance) ratio greater than 0.3, the measuring system is considered incompatible with the gear tolerances and therefore unacceptable for a process capability study. The P/T ratio shows how much of the gear tolerance would be "eaten-up" by the measuring system. Generally, a P/T ratio less than 0.1 indicates that the measuring system can reliably determine whether any given part meets the tolerance specification (Ref. 14).
A prudent practice is to study process capability for the blanks' datum features that are used for mounting gears in the gear cutting machine and inspection fixture. This will preempt and reduce some later work of investigating assignable causes if the process is found to be incapable.
Gear Characteristics: Typical Contributors to Their Process Capability
Since the introduction of AGMA 2015 standard in 2002, the three most widely used gear quality standards — ISO, DIN and AGMA — became conceptually the same. These three standards define tooth profile and tooth lead tolerances for total, slope, and form errors (Fig. 3).
Right and left flanks should be analyzed separately, as they may have different assignable causes for excessive errors and incapable processes.
For the process to be in control, all assignable causes must be found and eliminated (Ref. 1). To determine assignable causes, one must navigate multiple contributors to gear quality; i.e. — gear blanks; cutting/grinding machine; work-holding fixture; cutting tool and its re-sharpening or dressing consistency; set-up; cutting conditions; inspection equipment; and inspection fixture. In addition, each manufacturing system may have its own peculiarities, depending on the technology employed. Therefore the typical, assignable causes listed in this section should serve only as a starting point for developing a more comprehensive, customized list. Some hobbing-related examples follow below.
After determining the process capability indices (Cp and Cpk) — and finding out that the process is incapable — it would be prudent to start by investigating and addressing assignable root causes for a gear characteristic that has the worst capability index. Frequently, one assignable cause (for example, an excessive blank face run-out in relation to datum bore) adversely affects process capability indices of several gear characteristics.
Let's review one gear characteristic at a time:
Tooth Profile
Profile slope error, fHα. Figure 4 provides an illustration for calculating the profile slope average (mean) error (Ref. 9) and profile slope variation when three teeth are measured. Assignable causes for the slope average error and the slope variation are different. For example, a gear radial run-out may have a negligible effect on the slope average error, but a dramatic effect on the slope variation. It would therefore be prudent to analyze slope average error and slope variation separately, as it would make it easier to find assignable causes for each respective error.
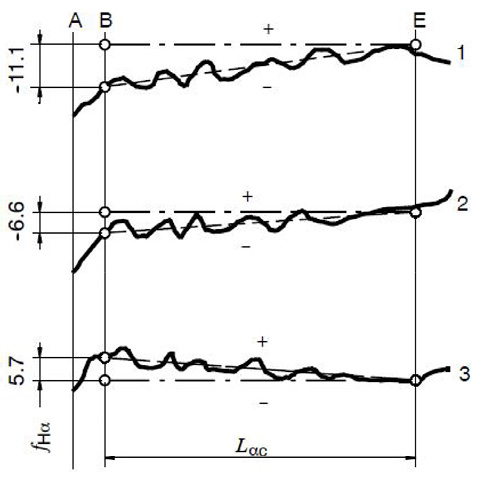
Figure 4 Average and Slope Variation — AGMA 915-1: average = (5.7+ (-6.6) + (-11.1)) / 3 = -4μm;variation = 5.7- (-11.1) = 16.8μm.
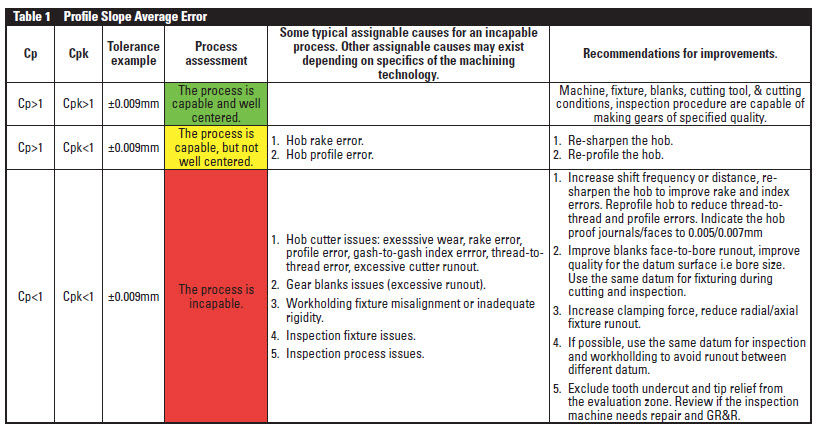
Profile slope average error, fHαm (Ref. 9). The slope error averaged between four teeth spaced roughly 90° around the circumference can provide insights into a cutting tool; i.e. — hob, shaving cutter, or grinder dressing quality issues as they affect the process capability. The tooth profile slope average feature has a bilateral tolerance, therefore both Cp and Cpk should be determined. Table 1 covers different Cp and Cpk scenarios and provides some typical, assignable causes for an incapable process.
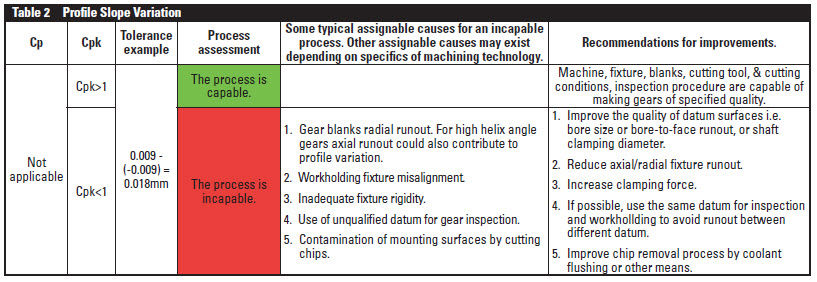
Profile slope variation. The slope variation between four teeth spaced roughly 90° around circumference can provide insights into fixture and blank quality, or other system contributors that create a radial run-out. The tooth slope variation is the difference between max/min slope errors as measured on four teeth of the same flank. Figure 4 shows an example for determining the slope variation error, as measured on three teeth. Note that the four-tooth measurement is a more reliable method for determining the slope variation error. If it is not defined on the drawing, the tolerance for the slope variation can be deduced from the slope tolerance. For example, if the slope tolerance is +/-0.009 m, the slope variation tolerance is (0.009- [-0.009]) = 0.018mm (Table 2). Table 2 covers different Cp and Cpk scenarios, and provides some typical assignable ranges for an incapable process.
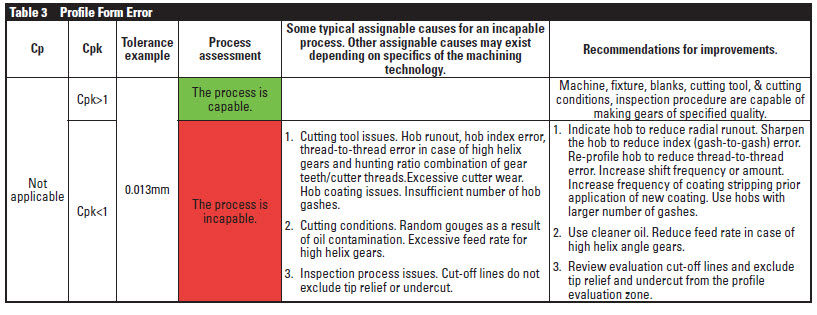
Profile form average error, ffα. Profile form error averaged between four teeth spaced roughly 90° around the circumference can provide insights into cutting tool quality and cutting condition. One can study the max form error instead of an average. However, the author recommends evaluation of the profile form average error instead, as it would reduce the sometimes confusing effects of random small cutting blemishes/gouges, random inspection machine sensitivities to an external environment, or inspection machine filtering issues. Table 3 provides some typical assignable causes for an incapable process.
Profile total error, Fα. The total error could be regarded as the sum of its component errors, i.e. — slope and form. When the process is capable for the slope and form characteristics, it would typically be capable for total error as well. If the process is incapable for the total error, one could make improvements by studying and improving the process for the components of the total error — slope and form errors — starting with the worst of the two.
Tooth Lead
Lead slope error, fHβ. Like causes of profile slope error, assignable causes of lead slope average error and lead slope variation come from different contributors. Gear wobble (axial run-out), for example, may have only a slight effect on slope average error, but a considerable effect on slope variation. Therefore, it would be prudent to analyze lead slope average error and slope variation separately.
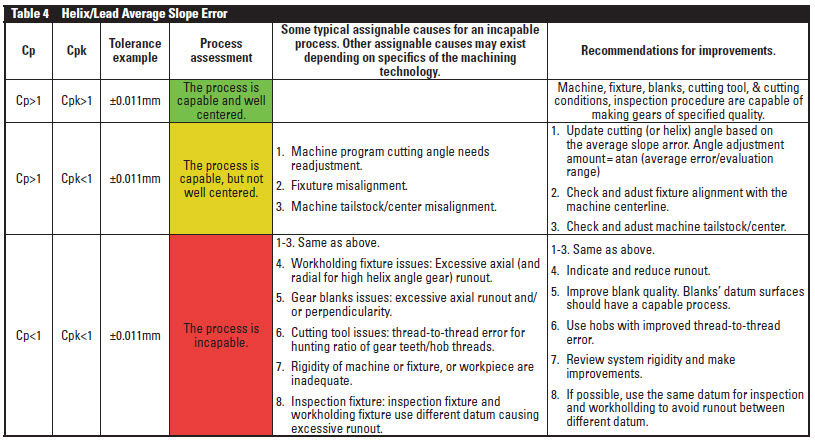
Lead slope average error, fHβm. The slope error averaged between four teeth spaced roughly 90° around circumference can be affected by various factors such as machining parameters, fixture alignment, or machine tailstock alignment, and others. The tooth lead slope error is a bilateral tolerance, so both Cp and Cpk should be determined (Table 4).
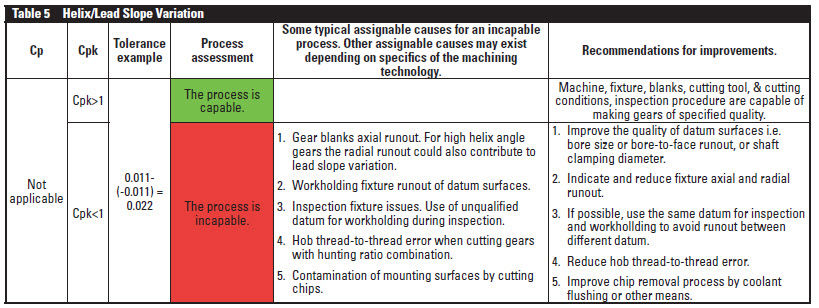
Lead slope variation. The slope variation between four teeth spaced roughly 90° around circumference is affected mainly by fixture and blank quality. The slope variation is the difference between the max/min slope errors, as measured on four teeth of the same flank. This characteristic has a unilateral tolerance that, if not specified on the drawing, can be deduced from the slope error tolerance. For example, if the slope tolerance is +/-0.009 m, the slope variation tolerance is (0.009- [-0.009]) = 0.018 m (Table 5).
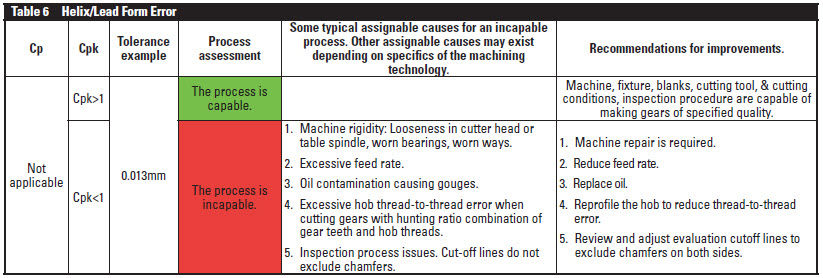
Lead average form error, ffβ.Lead form error averaged between four teeth spaced roughly 90° around circumference is affected by machine and fixture rigidity, cutting condition, coolant quality, and other factors. One can study the max form error rather than an average. However, the author recommends evaluation of lead average form error, as it would reduce often confusing effects of random small cutting blemishes/gouges, random inspection machine sensitivities to an external environment, or inspection machine filtering issues (Table 6).
Lead total error, Fβ.Like the profile total error, the lead total error could be regarded as the sum of its component errors — slope and form. When the process is capable for the slope and form errors, it is typically capable for the total error as well. If the process is incapable for the total error, one can make improvements by studying and improving the process for the components of the total error — slope and form errors — starting with the worst of the two.
Tooth Index
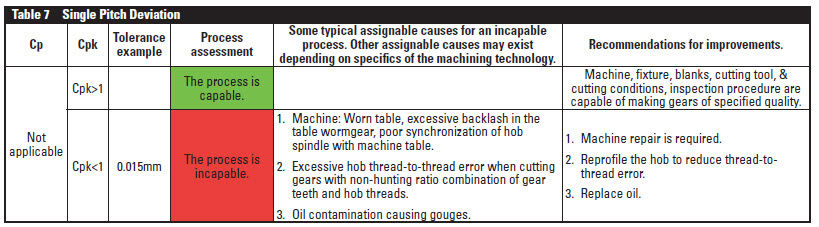
Single pitch deviation, fpt. The single pitch deviation (sometimes referred to as pitch variation) is the difference between theoretical pitch and actual distance between two adjacent teeth. Earlier AGMA and DIN standards also discussed spacing variation, i.e. — the difference between two adjacent pitches. Both pitch deviation (variation) and spacing variation errors are frequently affected by the same contributors (Table 7).
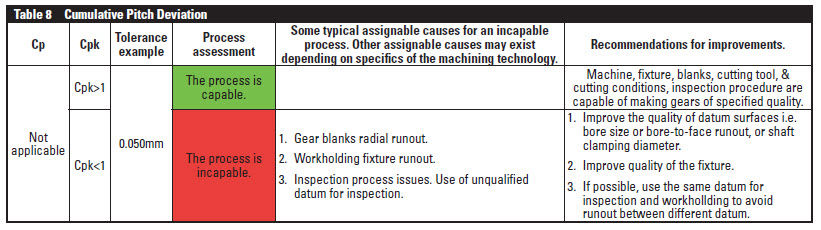
Cumulate pitch deviation, Fp. Cumulative/total pitch deviation. (Table 8) provides some typical assignable causes for an incapable process. More often than not, radial run-out is the main culprit for excessive cumulative pitch deviation.
Tooth Thickness
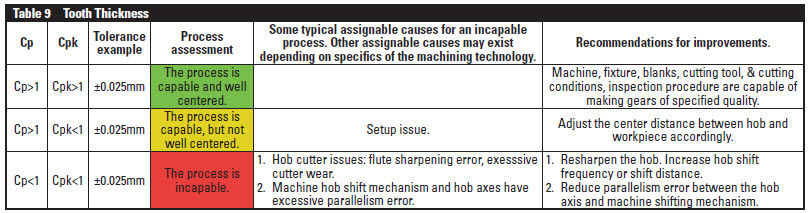
Tooth thickness (or dimension over pins or span measurement) has a bilateral tolerance, so both Cp and Cpk should be determined; average tooth thickness should be analyzed to exclude the effects of run-out (Table 9).
Practical Applications and Recommendations
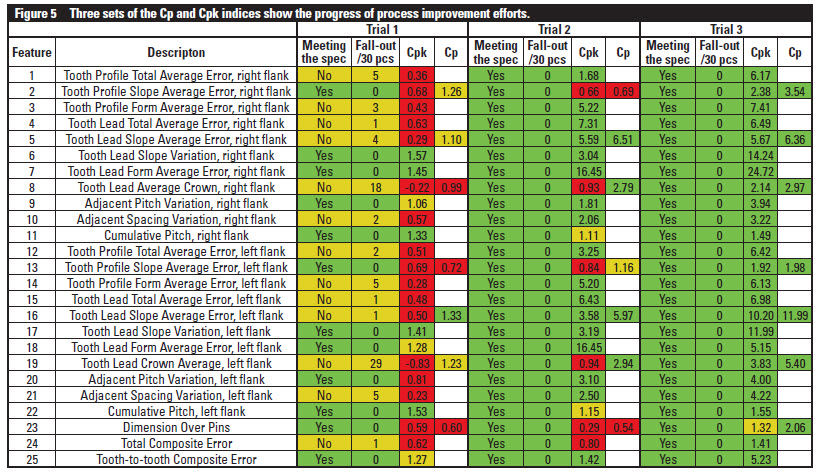
Figure 5 depicts a "real world" example of the multiple trial runs in the process to improve the capability of a tooth grinding operation, the goal being capability indices greater than 1.33. The first trial determined that the process was incapable — Cp and Cpk are mostly less than unity — (see red and yellow colors). This example shows that it took two additional trials to fully "de-bug" the process.
The process capability indices for gear characteristics, including profile and lead, can provide multiple benefits; a systematic approach to problem solving is just one of the benefits. Others include:
- Capability indices can qualify and quantify the capability of a new technology to consistently produce gears per required specifications.
- Capability indices can help compare and contrast capabilities of different technologies and/or processes.
- Capability indices can quantify existing processes that can help determine if a new technology is required.
- Processes that have capability indices greater than one can utilize a less-frequent inspection strategy, and therefore can benefit from improved efficiency and inspection cost reduction.
- When a quality issue arises, historical capability indices are powerful references that can help identify root causes with greater efficiency and confidence.
- Capability indices could also help more accurately predict the process cost — both fixed (machines) and variable (cutting tools).
Different gear cutting technologies have much in common. For example, an excessive gear blank "face-to-bore" run-out is the prime suspect for an assignable cause of an excessive lead slope variation, regardless of whether the gear was produced on a grinding, hobbing, shaving or shaping machine.
However, every technology has its own peculiarities. For example, one needs to address a grinding wheel, a shaving cutter or a shaping cutter when a profile form error needs to be reduced on a grinding, shaving or shaping machine, respectively.
Once again, the (common and assignable) root causes and recommendations for improvements suggested in this article are just starting points that could be expanded and tailored for specific machines, fixture, blanks, cutting tools, set-ups, and experiences.
In rare cases it is possible that after all assignable causes are explored and eliminated, the process becomes in control — but remains incapable. Since both assignable and common causes derive from the same contributors (i.e. — machine, fixture, blanks, cutting tool, set-up, and cutting conditions), one could attempt to find a dominant common cause contributor(s) by following the same process as the one described above. After the dominant, common cause contributor is identified, one could attempt to improve the process by tightening the tolerances of that contributor. For example, one could tighten the tolerances of blanks, or workholding fixture, or use a higher-precision cutting tool, depending on what the dominant contributor is. But if improvement of the contributing factors is not possible, a different gear manufacturing process should be considered — or gear tolerances should be revisited.
In conclusion, customers continuously demand better quality, greater reliability, and lower cost. Application of process capability indices will not only support your process improvement efforts, but will also quantify the improvements with transparency and confidence. 
Acknowledgments
 Yefim Kotlyar
 is a technical specialist at Navistar, responsible for the design and validation of gearing systems. His broad experience in the art of gearing includes the development of various gear cutting technologies, analytical inspections, and evaluation technologies for gears and hobs. Kotlyar has served on a number of AGMA technical committees, and he has authored numerous articles on gearing.
The author would like to express his deepest gratitude to John Beasley and German Alonso Acosta for their extensive technical support and encouragement.The author would also like to thank Mr. Acosta, Rochelle Zappia and Abe Dolgoff for their editing assistance.
References
- Sebetic, Robert L. Rockwell International. "Applying Process Control to Gear Manufacturing," Gear Technology Magazine, March/April 1992.
- Maiuri, Thomas J. "Buzz". Gleason, "Application of Statistical Stability and Capability for Gear Cutting Machine Acceptance Criteria," Gear Technology Magazine, November-December 2003.
- Cluff, B. W., C. Lutz, G. Ashcroft, J. Lange, R. Phillips and Y. Kotlyar. "Gear Process Dynamics: Sources of Errors in Hobbed Gears and Their Interpretations," American Pfauter, 1992.
- Cluff, B. W. "SPC Acceptance of Hobbing and Shaving Machines," Gear Technology Magazine, September-October 1991.
- Schaler, B.A. "A Checklist for Correcting Errors in Finish Hobbed and Shaved Involute Gear Teeth," AGMA Manufacturing Symposium, 1987.
- Kotlyar, Y. "Precision Finish Hobbing," Gear Technology Magazine, July-August 2000.
- Tool and Manufacturing Engineers Handbook, Volume 4, Quality Control and Assembly, ISBN 0-87263-177-3, 1987.
- AGMA 2015-1-A01 Accuracy Classification System - "Tangential Measurements for Cylindrical Gears."
- AGMA 915-1-A02 Inspection Practices - Part 1: "Cylindrical Gears - Tangential Measurements," Information Sheet.
- AGMA 915-2-A05 Inspection Practices - Part 2: "Cylindrical Gears - Radial Measurements."
- ANSI/AGMA ISO 18653-A06 Gears - "Evaluation of Instruments for the Measurement of Individual Gears."
-
Engineering Statistics Handbook, 6.1.6. "What is Process Capability?"
-
Process Capability Handout, Purdue University.
-
ANOVA Gauge R&R.


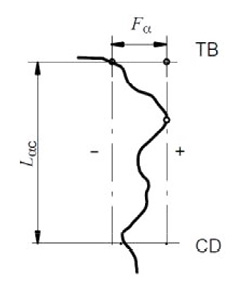
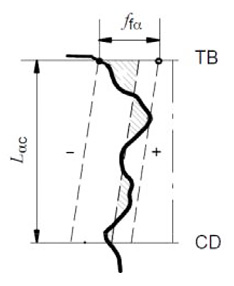
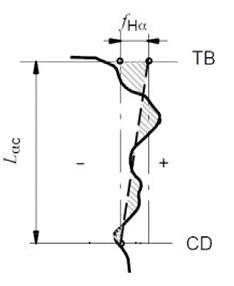 Figure 3 Total, slope, and form errors, AGMA 2015-1-A01.