Test Data Capture and Data
Analysis Software
For gear whine issues typical measurements
considered include noise measurements
via microphones, casing
vibration measurements via accelerometers,
and transmission error measurements
via angular encoders.
Measurements of gear whine should
include tests performed in-vehicle that
capture the full operating range through,
for example, vehicle accelerations at different
throttle levels and vehicle coastdown.
Further dyno rig tests should be
performed to isolate and understand
transmission and driveline noise sources.
Care must be taken in correlating any
rig test results with those of vehicle tests
and the original subjective noise problem.
Different boundary conditions on
the rig, as compared to in-vehicle, can
significantly change the dynamics of the
system and subsequent frequency content
of problem areas (Ref. 4).
Accurate data acquisition requires
calibrated microphones and accelerometers and high-fidelity data logging.
Further, an accurate speed signal
is required for analysis of component
orders. Measurement data can be captured
and analyzed using MEASA data
capture and analysis software. Data analysis
tools allow the user to process the
data in a number of ways. By linking to a
model of the transmission system under
consideration, potential excitation orders
and the components and harmonics to
which they correspond may be imported
into the data analysis tools to allow easy
identification of the main contributions
to specific orders and to the total noise/
vibration content. Critical plots given
include waterfall plots and order cuts
giving quantitative results for the noise
due to specific sources and their prominence
with respect to total noise (Fig. 3).
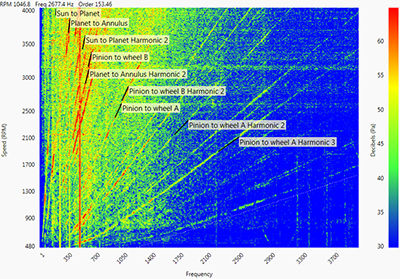
Figure 3 Measured noise displayed as a waterfall plot with
excitation orders automatically labelled via data from
a system simulation model.
- Click image to Enlarge
Although less common than noise
and vibration measurements, the source
of gear whine — loaded transmission
error — can also be measured using
angular encoders. For a transmission
or driveline system on a test rig, encoders
may be placed on the input and output
shafts in order to measure the whole
gearbox, or may be placed straddling
a sub-system to measure just that subsystem.
As with noise and vibration test
results, TE test results may be captured
and analyzed using MEASA. Fourier
analysis can be performed to identify the
contributions from different stages and
angular TE values can be converted to
linear via the base radius values for the
gears. A link to a model of the system
allows import of gear mesh orders and
their harmonics for easy identification
within the data analysis tool.
Using these measurement and data
analysis techniques, the nature of the
noise issue can be quantified and the
contributions from the potential excitations
in the transmission identified. But
how can design changes be made, their
effect on the problem assessed,
and solutions found efficiently
and cost-effectively? This is
the role of advanced transmission
and driveline simulation
software within
the troubleshooting
methodology.
Full System Simulation
Once a gear whine issue has been identified
and the contributions clarified via
measurement and data analysis techniques,
simulation software plays a vital
role in efficiently assessing potential
solutions. As gear whine is a system-level
issue, where solutions may be considered
from gear macro geometry design, gear
microgeometry design, system stiffness
and mass properties and the transmissibility
of TE to the casing, state of the art
system-level software is required to be
able to perform various analyses of interest.
Design changes need to be assessed
effectively — not just for their effect on
the noise problem at hand — but also for
other considerations of importance in
the design process so as, for example, not
to compromise durability.
Such durability, loaded tooth contact
and dynamic response analyses may be
performed using standalone commercial
FE packages. However, this approach is
problematic as it requires models with
different levels of fidelity to calculate
each aspect. What’s more, models are
very difficult to set up and do not lend
themselves well to analyzing the effects
of design changes easily and quickly. On
the other hand, integrated CAE software
such as MASTA provides tools
for engineers to perform these analyses
using a single model and parameter
set. And, model generation is rapid and
provides the flexibility to make complex
design changes on the fly, seeing immediate
results within a seamless workflow.
Analyses are fast enough to enable
parameter space DOE studies, including
assessing the robustness of any design
changes to the expected variability in
actual parts due to manufacturing and
assembly tolerances.
A range of analyses relevant for gear
whine problems can be performed on
the system-level model. To
begin, a number of static
analyses are usually performed
covering the operating
range to calculate
deflections of the system,
including misalignments
at gear meshes, and
durability results for components.
Baseline durability results
should be obtained and compared with
results when design changes are made to check that no compromise in durability
is introduced. The system deflection
model consists of an FE-based
model where shafts are considered as
Timoshenko beam elements; bearings
are represented via a bespoke non-linear
contact formalism, taking into account
the full geometry details; clearances, preloads,
etc., gear meshes are represented
as bespoke non-linear contact models;
and housings and complex asymmetric
shafts are included via stiffness and mass
matrices obtained via dynamic reduction
from a full FE model of the geometry.
Durability results for bearings, gears,
shafts and other coupling components
are obtained by passing deflections and
loads from the analysis results to implementations
of the relevant international
standards (Refs. 5–7).
Although it should be noted that the
solution to gear whine does not always
lie in optimizing gear microgeometry,
this is often the first area of investigation
due to its relative ease. Further, if
late in the development process, this is
often the easiest option to implement
due to the minimal change to manufacturing
processes and tooling required.
Calculation of TE can be performed
using a loaded tooth contact analysis
(LTCA). Torque, misalignment, gear
macro and microgeometry are used as
inputs. It is very important to use an
accurate LTCA in order to get an accurate
calculation of TE. A hybrid FE and
Hertzian, contact-based formalism are
used to accurately capture the stiffness
at each contact location while providing
a fast calculation suitable for assessing
microgeometry parameter changes and
robustness to tolerances (Fig. 4). Such
a calculation is comparable in accuracy
to a full FE contact analysis while being
many orders of magnitude faster. An FE
model of the gear macro geometry is
built automatically in the software and
used to obtain the overall bending and
base rotation stiffness of the gear teeth,
with consideration made for coupling
between teeth. This bending stiffness
is combined with a Hertzian line contact
formalism to calculate the overall
stiffness of any potential contact points.
Potential contact lines are split into
strips and force balance and compatibility
conditions are formulated and solved
(Ref. 8) to calculate the load distribution
across the mesh and the transmission
error for the input torque. This LTCA
can be used to optimize gear microgeometry
and macro geometry for minimal
transmission error. Consideration
must be given to the entire operating
range of loads and the robustness of the
proposed design to variation in load and
misalignments, as well as variation in
gear microgeometry within the manufacturable
tolerance range.
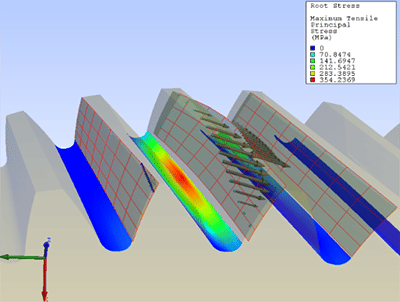
Figure 4 Hybrid FE and Hertzian-based
loaded tooth contact analysis.
- Click image to Enlarge
It is often assumed in the analysis
workflow described above that the
deflections of the system affect the tooth
contact — but the tooth contact conditions
do not affect the deflections of
the system. Hence, as above, a calculation
of misalignments is first performed
using a static system-level model, and
these misalignments, assumed constant
throughout the mesh cycle, are used as
inputs into the tooth contact calculation.
This assumption is often — but not
always — valid. In a number of important
cases, such as the tooth contact
conditions of a planet gear, the interaction
between the two meshes of the
planet means that the system deflection
and tooth contact conditions need to
be solved in a coupled calculation. In
such a calculation the assumption of a
fixed misalignment throughout the mesh
cycle is removed and the variation in
misalignment is calculated. Further, for
planetary systems where contact conditions
may vary, as the planet carrier
rotates, such a coupled calculation
is required. The software solutions discussed
here also provide such a calculation.
Tooth contact analysis results can
often provide good validation that the
analysis model is set up and performing
correctly. A contact patch test is a
relatively easy and common test to perform
and contact patch test results can
be compared directly against analysis
results (Fig. 5). If correlation is good,
this gives confidence in the analysis
model, implying that calculated misalignments,
microgeometry inputs, and
calculated load distribution under the
tested loads are accurate. Further, if TE
measurements have been performed,
measured and calculated, TE can be
directly compared.

Figure 5 Measured and simulated loaded contact patterns.
- Click image to Enlarge
Analysis of the dynamics of the system
can be performed via modal and harmonic
response analyses. For a modal
analysis of the system at a given input
load, a linearized model of the non-linear
static analysis model at that load is
automatically built. The natural frequencies
and corresponding mode shapes
can therefore be calculated for different
operating loads. Campbell diagrams
can be used to identify potential excitations
of the system where, for example,
gear mesh frequencies or their harmonics
cross the natural frequencies of the
system. Further, the energy content of
the mode shapes can be visualized and
investigated to identify the main contributing
components to those potential
resonances (Fig. 6). A target would
be to minimize the number of natural
frequencies within the operating range while also separating any way
in which do lie within the range
from each other.

Figure 6 Mode shape and kinetic energy content of
system mode at 701 Hz.
- Click image to Enlarge
The method of calculation of
the system response to the transmission
error introduced by
Steyer et al (Ref.9) can be used to
calculate the casing acceleration
at virtual accelerometer locations.
As the excitation is periodic
and the stiffness around the
loaded condition can be considered
linear, the calculation can
be performed very quickly in the
frequency domain. Static transmission
error is the assumed excitation
input of the system and the first step
is to calculate the dynamic force at the
gear meshes, which leads to a relative
displacement at the mesh given by this
transmission error. This force is known
as the dynamic mesh force that is calculated
from the dynamic compliances
at each side of the gear meshes. The
dynamic mesh force is then applied as
an excitation to the system model to calculate
the response at any point on the
system to this excitation. Waterfall charts
can be plotted of dynamic response for
any point on the model (Fig. 7) and
compared with accelerometer and/or
microphone data obtained via noise and
vibration tests.
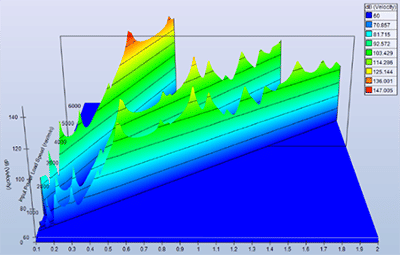
Figure 7 Calculated casing response to
excitation by transmission error.
- Click image to Enlarge
Once a virtual model is correlated
with test data, contributing modes to
problem frequencies can be identified
via the waterfall charts and natural frequencies.
Then, the contributing components
to those modes can be identified
with mode shapes and energy contributions.
With the results obtained,
the design of these components can
be adjusted to improve the dynamic
response of the analysis model. Once the
desired results are obtained, the design
changes can be implemented on a prototype
and tested again to confirm the
expected improvements.
Benefits of an Integrated Software
Approach to Troubleshooting Gear
Whine
- Reduced product development time
by targeting solutions in a virtual testing
environment.
- Reduced product development cost by
minimizing component testing.
- Allows production variation to be
investigated and minimized prior to
product launch.
Summary
The development cycle of transmission
systems is a complex and costly process.
With increased demands for lower-
noise transmissions and drivelines
driven by markets such as EV and HEVs,
more pressure is being placed on designers
to design for low noise and for analysts
to solve known gear whine issues
quickly and efficiently. Quick solutions
with minimal cost can be found with
a combination of solid methodology,
experience and the right software tools.
Software plays a vital role within this
process. Assessing, controlling and finetuning
designs for gear whine within
an integrated CAE environment, such
as that offered by SMT, where test data
capture and data analysis, together with
advanced simulation methods, are seamlessly
integrated, provides engineers with
the flexibility and freedom to achieve
new levels of quality otherwise too costly
and time-consuming to achieve through
physical prototyping alone.
References
- Smith, J.D. Gear Noise and Vibration, Second
Edition, Marcel Dekker, Inc. 2003.
2. D. R. Houser, D.R. et al. “Determining the
Source of Gear Whine Noise,” Gear Solutions,
February 2004.
- www.smartmt.com/masta.
- Meinhardt, G. et al. “Correlation of Axle
End-of-Line (EOL) NVH Performance and
Laboratory Dynamometer Performance,” SAE
2005 Noise and Vibration Conference, 005-01-
2306.
- BS ISO 6336-2: 2006(E). Calculation of Load
Capacity of Spur and Helical Gears — Part 2:
Calculation of Surface Durability (Pitting), 2006.
- BS ISO 6336-3: 2006(E).Calculation of Load
Capacity of Spur and Helical Gears — Part 3:
Calculation of Tooth Bending Strength, 2006.
- ISO/TS 16281: 2008(E). Rolling Bearings:
Methods for Calculating the Modified Reference
Rating Life for Universally Loaded Bearings,
2008.
- Conry, T.F. and A. Seireg. “A Mathematical
Programming Method for Design of Elastic
Bodies in Contact,” J.A.M. ASME, 2, 1971
- Chung, C. and G. Steyer et al. “Gear Noise
Reduction Through Transmission Error Control
and Gear Blank Dynamic Tuning,” SAE Noise
and Vibration Conference 1999-01-1766.
About Author
Dr. Paul Langlois is
CAE products development
department manager at
Smart Manufacturing
Technology Ltd. (SMT).
Having worked for SMT for
10 years, he has extensive
knowledge of transmission
analysis methods and their software
implementation. He manages the development
of SMT’s software products and was a main
contributor to many aspects of the technical
software development, such as MASTA’s
gear-loaded tooth contact analysis and NVH
functionality.