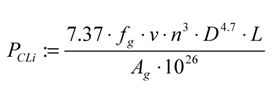
The postulated expression proposed by Anderson et al. for the instantaneous coefficient of friction for spur gears is detailed in Equation 7 and was employed by the authors for this investigation (Refs. 1-2). The coefficient of friction is given as:
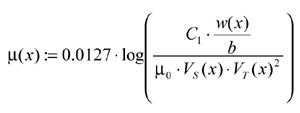 (7)
(7)
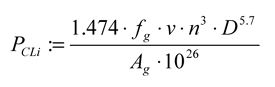
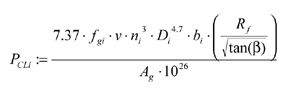
The contact length for helical gears, Lc, has been detailed and was substituted by the authors into Equation 7 (Ref. 7). Therefore, the modified equation for the coefficient of friction for helical gears is given as:
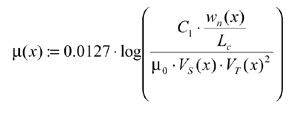 (8)
(8)
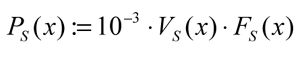
The coefficient of friction used in this analysis is independent of the gear surface temperature, which--strictly speaking--is inaccurate. The expression in Equation 8 was substituted into Equation 6 to obtain the sliding power losses.
Rolling friction loss. The rolling friction loss is dependent on the instantaneous rolling velocity and the instantaneous lubricant film thickness. As the gear teeth come into mesh, an elastohydrodynamic lubricant film is developed between the teeth in contact. The action of the gear teeth during the engagement draws the lubricant into the contact zone. The parameters that influence the rolling friction loss are the lubricant film thickness, the angular velocity of the gears, the working pressure angle and the point of contact along its contact path. The lubricant properties influence the buildup of the lubricant film, its shear values and its thermal behavior. In addition, the gear material and the normal tooth load also influence the film thickness. In References 1-2, Anderson et al. postulated the instantaneous rolling friction force as:
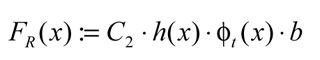 (9)
(9)
where the rolling power loss is given as:
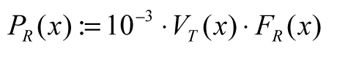 (10)
(10)
This expression for instantaneous rolling force includes a thermal reduction factor that accounts for the decrease in oil film thickness as the pitch-line velocity increases (Ref. 6). A relationship between thermal loading factor and reduction factor was presented by Anderson et al. and employed by the authors of this investigation (Ref. 1). The paper by Anderson et al. implied that prior to computing the thermal reduction factor, the thermal loading factor must be determined. To account for helical gears, the expression of Equation 12 was modified by the authors, as the contact line length in helical gears is not synonymous with the face width. The modified instantaneous rolling force is given as:
 (11)
(11)
where Lc, has been defined as the contact length for helical gears. The expression was substituted into Equation 10 to obtain the sliding power losses.
Mathematical Model
The mathematical model employed for this investigation consisted of the following expressions:
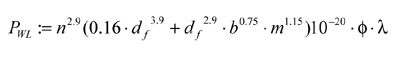
1. The windage loss equation as employed by Townsend (Ref. 3).
2. Churning loss expressions as detailed in BS ISO/TR 14179, Part 1 (Ref. 5).
3. The rolling and sliding friction losses as postulated by Anderson et al. (Ref. 1).
Model Validation
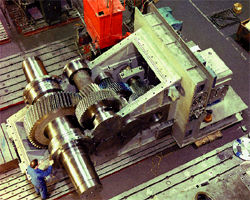
The gearbox used to validate the model was a single-stage, double-helical, speed-increasing gear unit with oil film bearings of the circular type. The inlet oil temperature was 49°C, and the maximum bearing temperature did not exceed 87°C. The input shaft and the output shaft end were sealed by means of a shaft-mounted oil flinger and non-contacting baffle rings in the housing. A lubrication pump was driven via a set of reduction gears from the input shaft. The pump supplied the lubricant for the gear sprayers and the force-fed bearing. The gear unit was tested in a back-to-back arrangement (see Fig. 1). A torque loader was fitted between the output shaft
coupling end of the slave unit and the output shaft tail end of the test unit. The torque loader used for the experiment employed a pressurized oil system. The oil was supplied via a rotary union (see Fig. 1). The torque loader consists of an inner rotor and outer rotor, which are supported in bearings. Oil is fed into the space between the two rotors, creating a torsional load in the test rig. The bearing losses in the torque loader were calculated separately beforehand and subtracted from the motor input power prior to calculating the gearbox efficiency.
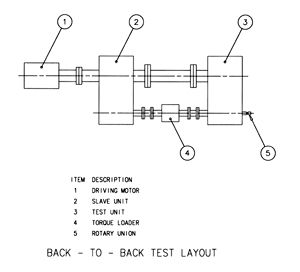
Figure 1--Schematic of the back-to-back arrangement for the high-speed gear unit.
The load conditions for the experiment included 25%, 50%, 75%,and 100% of full load (8.95 MWatts), at 100% input speed (1,460 rpm). Experimental torque readings were taken with a telemetric system from the low speed shaft via strain gauges. Appendix A details some gear data. It must be noted that the rig was run at full load and maximum speed (1,460 rpm) for a period of four hours. Prior to undertaking this test,the gear unit was visually inspected to ensure gear contact markings were satisfactory full face and full depth.
The mathematical model for the helical gears in this instance was accomplished by doubling the face width. The oil mix function was assumed to be φ = 3 and the gearbox space function was taken as λ = 1 as the gear case walls were sufficiently far away from the gears to be considered as free space. No oil churning took place, as this was a spray-lubricated arrangement. The experimental results provided the efficiency for the complete gear unit; therefore, the
bearing losses, seal losses and absorbed power for the lubrication pump had to be calculated from manufacturer’s information (see Appendix B). The power loss calculations for the bearings assumed
the maximum clearance condition. As non-contacting seals were employed, no power losses from the seals were assumed.
As the lubrication pump reduction gears were not separately sprayed, the oil mist present inside the gear case was assumed sufficient to provide lubrication. Again the same oil mix function and gearbox space function were assumed. The total predicted power losses were the sum of the losses from the lubrication pump and the gearbox. Results are detailed in Table 1. A comparison between predicted and experimentally determined power losses is shown in Figure 2. The model predicts a steady decline in power loss corresponding to a reduction in load.
| Table 1--Experimental and Theoretical Results of Experiment I. |
| Power input (kW) |
8,952 |
6,714 |
4,476 |
2,238 |
| %load |
100% |
75% |
50% |
25% |
| Experimental total loss (kW) |
125.33 |
116.82 |
112.35 |
106.75 |
| Experimental total loss (kW)for gear and windage only |
55.08 |
50.15 |
50.16 |
49.42 |
| Predicted total loss (kW) |
57.41 |
53.3 |
49.86 |
47.42 |
| Breakdown of Losses |
| Sliding friction loss (kW) |
10.88 |
6.672 |
3.05 |
0.34 |
| Rolling friction loss (kW) |
5.71 |
5.821 |
5.98 |
6.27 |
| Churning loss (kW) |
0 |
0 |
0 |
0 |
| Windage loss (kW) |
40.82 |
40.82 |
40.82 |
40.82 |
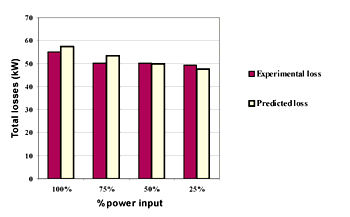
Figure 2--Comparison between experimental gear and windage losses and predicted power losses.
It was observed that by increasing the power input at a fixed rotational speed, the windage losses remained the same and the rolling friction power losses decreased while the sliding loss increased.
Discussion and Conclusion
The mathematical model detailed in this paper has shown to be valid, providing an indication of the contribution of each element within a gearbox with helical gearing to the total power loss. The predictions and the experimental results show a good correlation, although the experimental results do not provide a breakdown of the various power losses. In the breakdown of losses in Experiment I, it can clearly be seen that the sliding friction losses are heavily load dependent, increasing with load. However, the rolling friction losses decreased slightly with an increased load, and this is due to a decrease in oil film thickness. As the speed was constant during the
experiment, windage losses remained constant throughout the tests.
This investigation did not review or include new mathematical models for load-dependent bearing losses and speed-dependent bearing churning and seal losses.
Acknowledgments
The authors wish to express their gratitude to David Brown, Textron Power Transmission for allowing the publication of this investigation, undertaken as a degree project for a master’s of science in Design of Rotating Machines, Cranfield University. This paper was presented at the ASME/AGMA 2003 International Power Transmission and Gearing Conference, held Sept. 3-5, 2003, in Chicago, IL, and was published in Proceedings of the 2003 ASME Design Engineering Technical Conferences & Computers and Information in Engineering Conference. It is republished here with permission from ASME.
References
1. Anderson, N.E., and S.H. Loewenthal. "Spur gear system efficiency at part and full load," Technical Report 79-46. NASA Technical Paper 1622, 1980.
2. Anderson, N.E., and S.H. Loewenthal. "Efficiency of nonstandard and high contact ratio involute spur gears," Journal of Mechanisms, Transmissions, and Automation in Design, Vol. 108, March 1986, pp. 119-126.
3. Townsend, D.P. "Lubrication and cooling for high speed gears," Original Equipment
Manufacturing Conference, Sept. 9-11, 1985, Philadelphia, PA.
4. Luke, P. and A.V. Olver. "A study of churning losses in dip-lubricated spur gears,"
Proceedings of the Institution of Mechanical Engineers, Part G, Vol. 213, 1999, pp.
337-346.
5. British Standards Institution, BS ISO/TR 14179:2001(E), Gears--Thermal Capacity,
BSI, London, United Kingdom, 2001.
6. Wu, S., and H.S. Cheng, "A friction model of partial-EHL contacts and its application to power loss in spur gears," Tribology Transaction, Vol. 34, Part 3, 1991, pp. 398-407.
7. American Gear Manufacturers Association, AGMA Standard 218.01, Rating the pitting resistance and bending strength of spur and helical involute gear teeth, AGMA, Alexandria, VA, December 1982.
Petra Heingartner is a Textron Six Sigma black belt for fluid and power at Textron Fluid & Power, located in Huddersfield, England. She leads cross-functional teams to improve work processes throughout the business. Previously, she was a senior design engineer and a senior applications engineer of Textron’s custom-made heavy industrial gear units.
Dr. David Mba is senior lecturer and postgraduate course director in the automotive, mechanical and structures engineering department at Cranfield University, located in Cranfield, England. He is director of the master’s course "Design of Rotating Machines" and is responsible for its industrial collaborations and is director of the continued-professional-development course "Gear Design." He also leads the department’s machine diagnostics group, which is involved with consulting and doctoral research. Mba specializes in machine diagnostics, rotor dynamics and machine design. Also, he’s developing a research and experimental facility to predict nonload gear losses in worm gearboxes.
| Nomenclature |
| Ag
|
Arrangement constant A g =0.2 |
| C1
|
Constant,29.66 |
| C2
|
Constant,9 ·10 7 |
| D |
Element diameter |
| FR
|
Rolling force |
| FS
|
Sliding force |
| Lc
|
Contact line length |
| PCL
|
Churning power loss |
| PR
|
Rolling power loss |
| PS
|
Sliding power loss |
| PWL
|
Windage power loss |
| Rf
|
Roughness factor |
| VS
|
Sliding velocity |
| VT
|
Rolling velocity |
| b |
Face width |
| df
|
Root diameter |
| dk
|
Outside diameter |
| fg
|
Gear dip factor
(Ratio of dipping depth to element outer diameter)
fg = 1 element fully submerged |
| h |
Isothermal central film thickness |
| mn
|
Normal module |
| n |
Rotational speed |
| w |
Load parameter |
| wn
|
Normal gear contact load |
| Β |
Helix angle |
| λ |
Gearbox space function |
| μ |
Coefficient of friction |
| μ0
|
Ambient viscosity at ambient temperature |
| v |
Kinematic viscosity at operating temperature |
| φ |
Oil mixture function,φ =1 oil-free atmosphere |
| φt
|
Thermal reduction factor |
| Subscripts |
|
| i |
Element under consideration |
| Appendix A--Gear Data |
|
|
|
Units |
|
| Pinion teeth number |
z1
|
115 |
-- |
|
| Wheel teeth number |
z2
|
21 |
-- |
|
| Center distance |
a |
609.6 |
mm |
|
| Normal module |
m |
8 mm |
|
|
| Normal pressure angle |
α |
20 |
deg. |
|
| Helix angle |
Β |
25 |
deg. |
|
| Face width |
b |
285.75 |
mm |
Double helical |
| Pinion shift coefficient |
x1
|
0.989 |
-- |
|
| Wheel shift coefficient |
x2
|
0.181 |
-- |
|
| Pinion, Young’s modulus |
E1
|
207,000 |
N/mm 2 |
|
| Wheel, Young’s modulus |
E2
|
207,000 |
N/mm 2 |
|
| Pinion, Poisson’s ratio |
ny1
|
0.3 |
|
|
| Wheel, Poisson’s ratio |
ny2
|
0.3 |
|
|
| Specific heat |
C1
|
544 |
J/kgK |
|
| Specific heat |
C2
|
544 |
J/kgK |
|
| Thermal conductivity |
K1
|
46 |
W/mK |
|
| Thermal conductivity |
K2
|
46 |
W/mK |
|
| Application |
| Pinion speed |
n1
|
1,460 |
rpm |
|
| Transmitted power |
P |
8,952 |
kW |
|
| Lubricant |
| Lubricant factor |
-- |
1 |
|
for mineral oil |
| Viscosity |
ny |
46 |
mm 2 /s |
at 313 deg. K |
|
ny |
21 |
mm 2 /s |
at 333 deg.K |
| Specific gravity |
ρ |
873 |
kg/m 3 |
|
| Dynamic viscosity |
η |
0.01833 |
Pa*s |
|
| Viscosity-pressure coefficient |
α |
2.20E-08 |
m 2/N |
|
| Thermal conductivity |
Kf
|
1.25E-01 |
W/(m*K) |
|
| Appendix A--Calculated Gear Data |
| Contact line length |
L c |
mm |
499.57 |
| Operating diameter speed |
v |
mm/s |
78,811 |
| Gear contact tangential load |
W pt |
N |
113,588.59 |
| Gear contact normal load |
W pn |
N |
133,374.62 |
| Equivalent Young’s modulus |
E eq |
N/mm 2 |
227,472.53 |
| Pinion torque |
T 1 |
Nm |
58,551.58 |
| Appendix B--Bearing, Lubrication Pump and Seal Losses |
| Power input (kW) |
8,952 |
6,714 |
4,476 |
2,238 |
| %load |
100% |
75% |
50% |
25% |
| Experimental total loss (kW) |
125.33 |
116.82 |
112.35 |
106.75 |
| Power Loss in Each Bearing |
| Pinion coupling bearing (kW) |
22.9 |
21.37 |
19.37 |
17.28 |
| Pinion tail bearing (kW) |
22.9 |
21.37 |
19.37 |
17.28 |
| Wheel coupling bearing (kW) |
3.93 |
3.67 |
3.43 |
3.09 |
| Wheel tail bearing (kW) |
3.93 |
3.67 |
3.43 |
3.09 |
| Lubrication Pump |
| Absorbed power (kW) |
16.59 |
16.59 |
16.59 |
16.59 |
| Seal Losses at Each Shaft (kW) |
| Pinion coupling (kW) |
0 |
0 |
0 |
0 |
| Wheel coupling (kW) |
0 |
0 |
0 |
0 |
| Total loss (kW) |
70.25 |
66.67 |
62.19 |
57.33 |


 (1)
(1) (2)
(2) (3)
(3) (4)
(4) (5)
(5) (6)
(6)