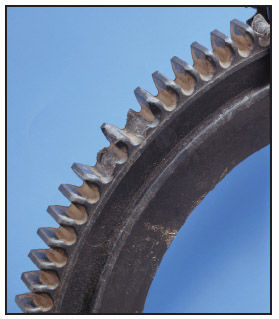
Figure 3—-Gear with broken teeth.
To assess the effect of the repeated nature of the load application in a gear set, some form of fatigue data is important. Flexural fatigue is a common test, but tensile fatigue testing can also be useful. Flexural fatigue testing requires a unique sample configuration, but the current ASTM standard (D671-93) has been withdrawn by ASTM and has not been replaced. Tensile fatigue tests can be run on the same type of sample used for other tensile tests, and tensile fatigue testing also better mimics the stress application seen in a one-directional gear-on-gear wear test currently being run by GE Plastics. Fatigue failures in gears can look like overload failures (tooth breakage at root), or can lead to thermal failures as the repeated flexing of the tooth leads to hysteresis heating and material flow (Fig. 4).
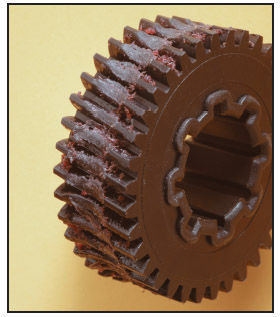
Figure 4—-Gear with melted teeth.
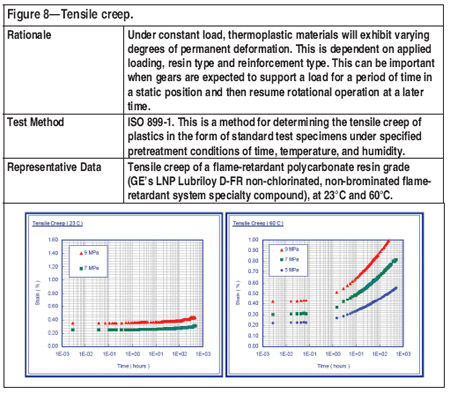
While it’s typical to consider the cyclic nature of gear loading in most applications, many applications require the gear to hold a load in a fixed position for some period of time. In these situations it will be important to understand the material’s creep performance—that is, its tendency toward permanent deformation. Under constant load, thermoplastic materials will exhibit varying degrees of permanent deformation, dependent on applied loading, resin type and reinforcement type. If, in a particular application, a gear is holding a load (that is, the teeth are under constant load), the teeth under load could deform permanently, potentially leading to increased noise, loss of conjugate action or outright tooth failure due to interference.
Wear Behavior
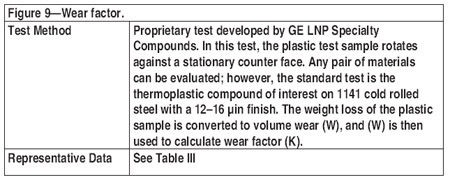
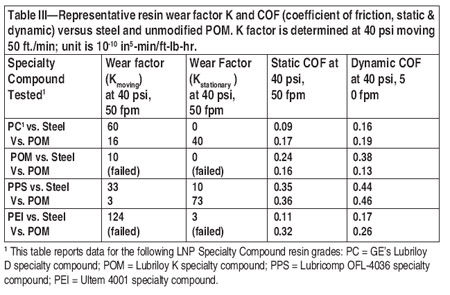
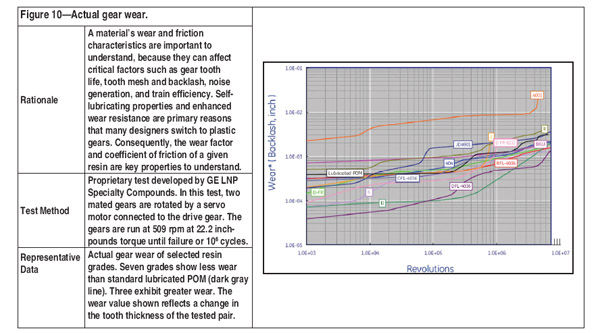
Tribological factors are highly important in all gear applications. A material’s wear and friction characteristics are important to understand, because they can affect such critical factors as gear tooth life, tooth mesh and backlash, noise generation, and gear train efficiency. Self-lubricating properties and enhanced wear resistance are primary reasons that many designers switch to plastic gears. Consequently, the wear factor and coefficient of friction of a given resin are key properties to understand.
Even if the material data suggest that a particular material is strong enough to carry the applied load for the number of cycles expected in the application, another concern is wear of the gear set. The removal of material from the active flank of a gear tooth can dramatically limit the life of the gear, since a thinner tooth may not support the design load of the application (Fig. 5). Wear behavior is influenced by the materials/fillers used in the gear pair, environmental conditions and contaminants, and the load condition of the application.
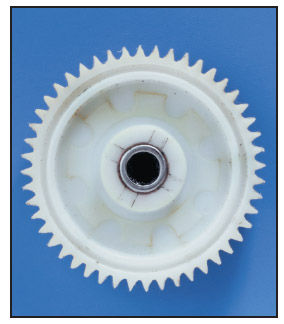
Figure 5—-Thinned gear teeth.
Two different tests have been used to characterize the wear performance of gears. Traditional wear testing is done on a thrust washer wear configuration, which places the raised edge of a rotating disc (moving sample) in contact with another material (stationary counterface). The volume of material lost during the test is recorded, and a wear factor is calculated for both the moving and stationary sample. Measurements of coefficient of friction can also be made during the test. Versions of this test have been widely used to determine if a particular material pair “wears well” or not. Failures can be characterized as a large loss of material (high wear) or a thermal failure (material flow, “PV” or pressure-velocity failure) due to frictional heat generation.
A new type of wear test using actual molded gears has also been developed. In this test two molded gears are run together at a predetermined speed and load. Any loss of material from the face of the gears is detected as a shift in the phase angle between the driving and driven gear shafts. This phase shift is expressed as a linear value and charted against the time the gear set is running. This wear value is a combination of the loss of material from the gear tooth and any additional deflection caused by the tooth thinning or increased flank temperatures. Some might describe the value as an increase in backlash, but backlash has a specific definition in gearing that doesn’t fit this value. This same test can be used to generate fatigue curves (S-N) for a set of gears by simply running the gears at a series of loads/speeds and plotting the curves vs. cycles. Tooth wear as a factor in failure must be included. Similar tests are being adopted by the industry for application testing and validation.
Dimensional Stability
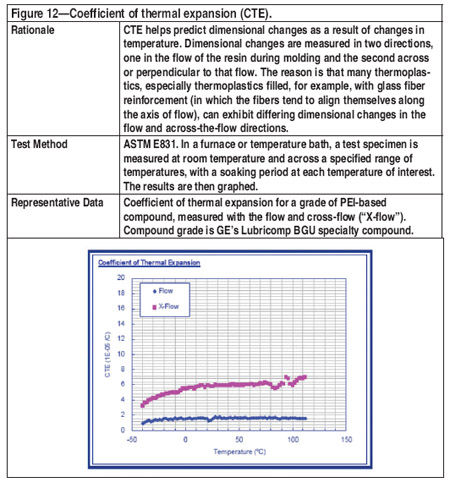
Even the best-designed gear set that uses an appropriate material for the strength and wear requirements of the application can fail if the gears cannot be held at the proper operational center distance. Two aspects of thermoplastics that can make this a challenge are changes in the size of the gear due to temperature change and moisture absorption. For most materials the thermal component will overshadow any growth due to moisture absorption. A gear designer needs to consider the gear mesh not only at a maximum and minimum material condition (as a result of runout in the finished gear), but also at those conditions as influenced by the maximum and minimum temperature in the application. Multi-point coefficient of thermal expansion data can be consulted to evaluate this effect.
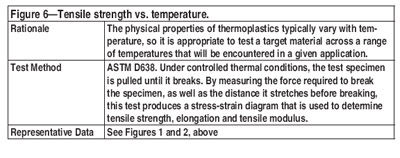
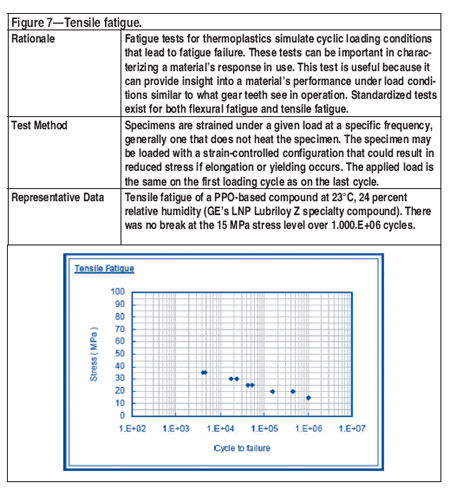
Figures 6–12 discuss the testing of different gear-related parameters. In each figure, you will find (a) the rationale for considering a parameter as important to gears; (b) the test method; and (c) representative data. The data are necessarily representative because space limitations preclude inclusion of all data gathered to date for all compounds evaluated.
Dimensional Accuracy
Typically, the mold shrinkage values given for a material have been determined by measuring the shrinkage of a 5" x 1/2" x 1/8" rectangular bar measured in accordance with ASTM D-955 test methods, or a 60 mm x 60 mm x 2 mm plaque for ISO 294 test methods. These values are usually given corresponding to the dimensions that are parallel (flow) and perpendicular (transverse) to the direction of melt flow in the part. They are normally expressed as “inch/inch” or sometimes as a percentage. These mold shrinkage values can be useful in comparing the relative shrink rate of one material to another, but they should not be treated as absolutes. Mold shrinkage can and will vary with part thickness, mold layout, processing variations, and mold temperature.
Of greater value is mold shrinkage data collected on an actual part, whether it is a simple prototype mold or a similar application. It was this approach that was used to study the effect internal lubricants and reinforcements have on the overall accuracy of a gear. A series of gear cavities based on a common spur gear geometry was created to mold a range of materials. The molded sample gears were then used to study how material composition affects dimensional parameters, including:
• Warpage
• Eccentricity
• Radial composite error
• Profile and helix deviation
• Pitch deviation
Specific data are not supplied here, because the range of conditions and results generated are both too extensive for presentation and are beyond the scope of this article.
Your Design Methodology
Key to specifying materials for gear applications is a full understanding of material properties in the conditions that the gear train will see in use. The availability of multipoint data is crucial for this engineering process. As a specifier, you will be best served by working with materials experts who can provide a rich dataset—one that captures performance across the full range of end-use environments—and, further, can work with both design and manufacturing to refine the selections from a universe of outstanding material candidates.
LNP, Lubriloy, Lubricomp and Ultem are trademarks of GE Plastics.
Jim Fagan is a product manager for the LNP Specialty Compounds division of GE Plastics. He has worked for LNP/GE Plastics for 14 years in various commercial and technical roles, including field sales and marketing, application development, technical service and product marketing. He has a bachelor’s degree in mechanical engineering and a master’s degree in business administration.
Ed Williams is a regional technical leader for GE Plastics and chairman of the AGMA Plastic Gearing Committee. A 1986 graduate of Pennsylvania State University with a B.S. in polymer science, he has been with LNP/GE Plastics since 1987. His primary responsibilities have included application development for internally lubricated, statically conductive, EMI shielding, and thermally conductive thermoplastic compounds.