Among other calculation results,
RIKOR calculates the load distribution.
For the integrated bearing calculation in
RIKOR, the geometrical data of the bearings
are used (e.g., ball diameter, angle of
taper, etc.). The load distribution between
the rolling elements and race way in the
bearing is calculated. Then the data are
provided for other calculations, such as
the mesh calculation used in this project.
Comparison of mesh excitation for
designed and measured microgeometry
— determination of microgeometry.
The microgeometry is one of the most
important influence parameters on vibration
excitation of gears. Therefore it is
necessary to model gear microgeometry
as accurately as possible. Since the
designed microgeometry is often not
sufficient, the microgeometry has to be
measured topologically. All teeth on both
flanks were measured topologically with
30 points in face width direction and 30
points in tooth profile direction using a
Klingelnberg P40 measuring center. This
topological data was converted for use
as microgeometry in the calculation program.
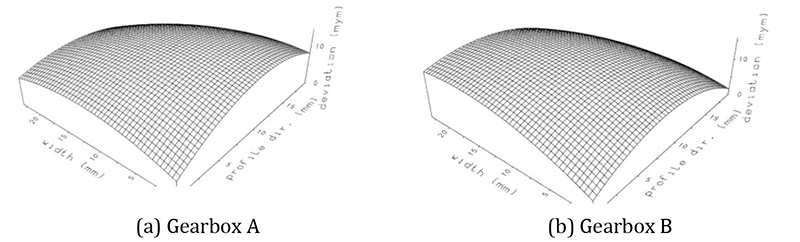
Figure 2 shows the designed microgeometry
of the two examined drive gears.
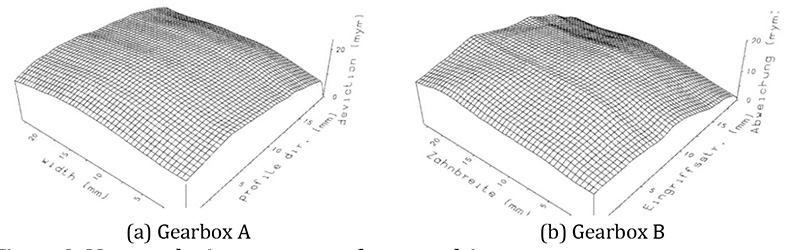
In Figure 3 the averaged microgeometry
of the examined drive gear from topological
measurement in the whole field
of action is shown. There are some differences
between the designed microgeometry
and the measured microgeometry
— which could influence the excitation.
Since the deviation of individual
teeth is even greater than the averaged
microgeometry, the influence on excitation
can be increased additionally.

Figure 2 Nominal microgeometry of counter drive gear.
- Click image to enlarge

Figure 3 Measured microgeometry of counter drive gear.
- Click image to enlarge
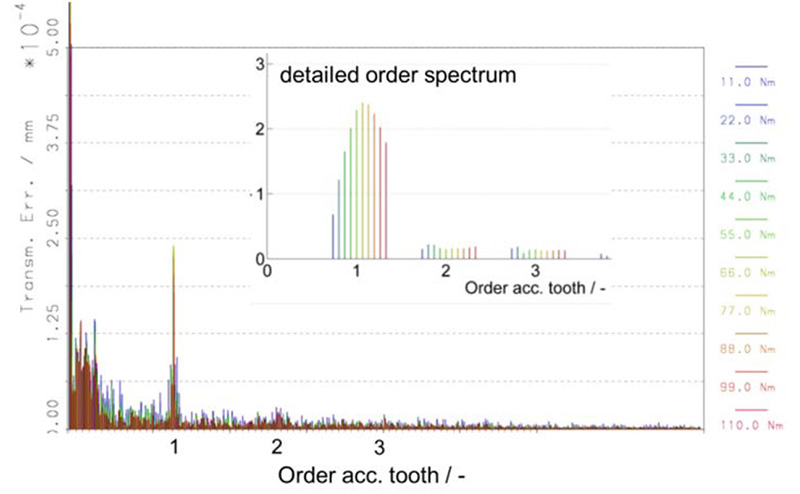
Transmission error. The calculation
of transmission error has been done for
both designed and measured microgeometry;
the time-dependent curves were
transformed into the frequency domain.
In the generated spectra the exciting
characteristics of the mesh could
be analyzed properly. In Figures 4 and 5 the results are shown for the design
microgeometry.

Figure 4 Transmission error with the designed microgeometry for gearbox A counter drive
stage at different load.
- Click image to enlarge
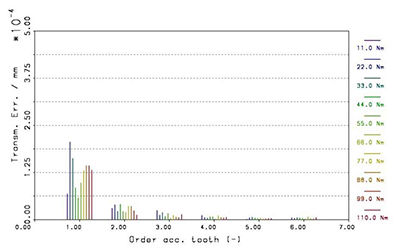
Figure 5 Transmission error with the designed microgeometry for gearbox B counter drivestage
at different load.
- Click image to enlarge
Both gearboxes show
comparable exciting characteristics. The
amplitudes of transmission error are
very low level from 0.03 μm to 0.2 μm
for 1st order. The results of the transmission
error calculation with measured
microgeometry are shown in Figures
6 and 7; the calculation was done with
the individual measured flank geometry
for each tooth (no averaging). Because
every tooth is different in this calculation,
more orders are visible — not only
integer orders. Therefore in the pictures
of full order spectra (Figs. 6 and 7)
there is shown only the shape of amplitudes,
but no development of amplitudes
of TE with increasing load (different
colors). For this reason the details
of the spectra are displayed in Figures
6 and 7.
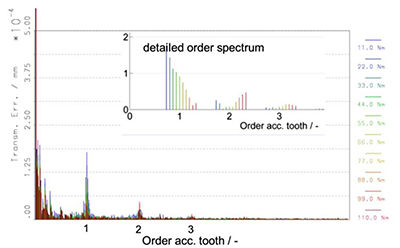
Figure 6 Transmission error with the measured microgeometry for gearbox A counter drivestage
at different load.
- Click image to enlarge
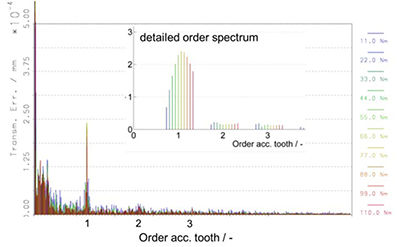
Figure 7 Transmission error with the measured microgeometry for gearbox B counter drivestage
at different load.
- Click image to enlarge
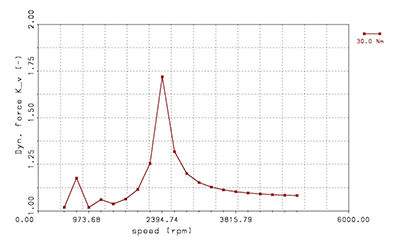
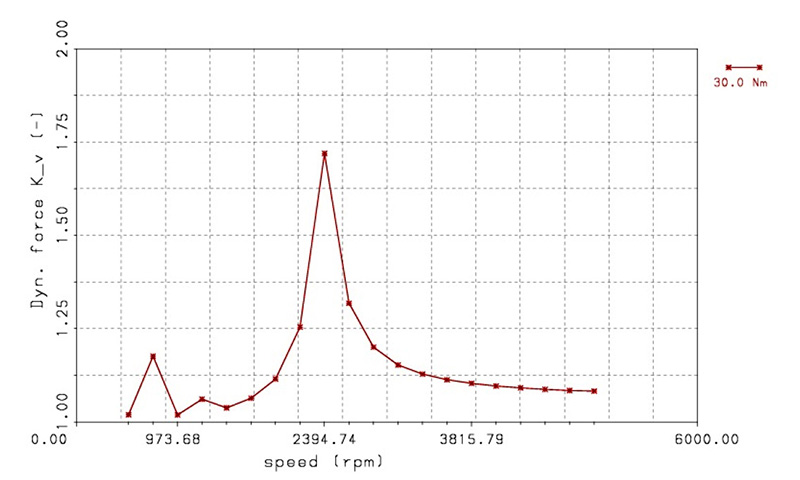
Figure 8 Resonance curve with designed microgeometry for gearbox A.
- Click image to enlarge
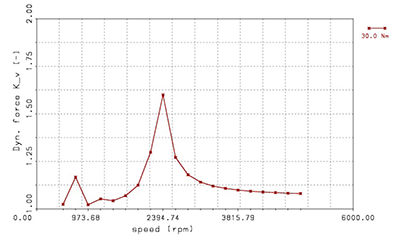
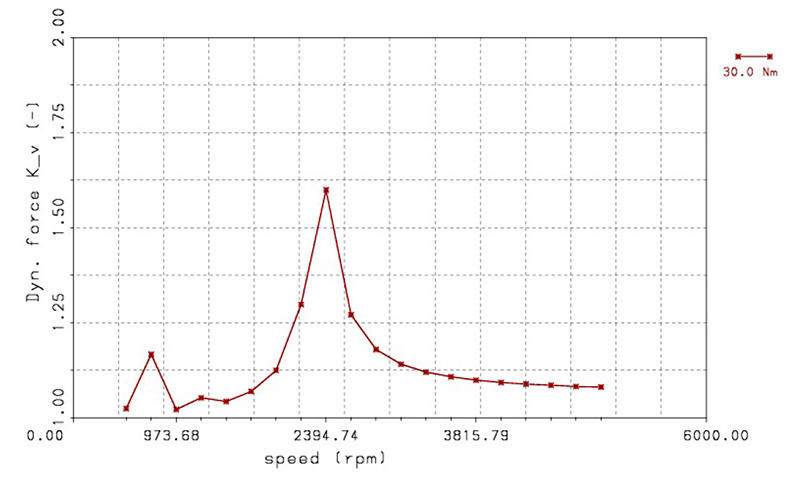
Figure 9 Resonance curve with designed microgeometry for gearbox B.
- Click image to enlarge
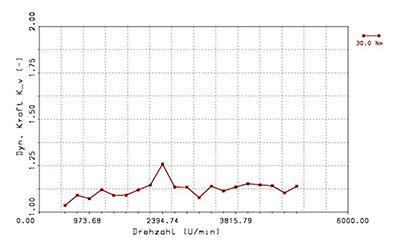
Figure 10 Resonance curve with measured microgeometry for gearbox A.
- Click image to enlarge
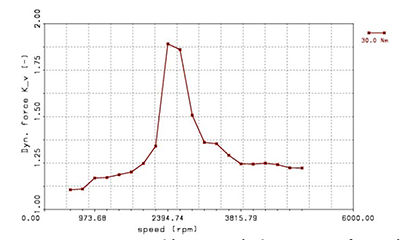
Figure 11 Resonance curve with measured microgeometry for gearbox B.
- Click image to enlarge
When comparing the transmission
error with designed microgeometry
and measured microgeometry,
there are different statements between
the gearbox A and B. Regarding gearbox
A, the excitation of tooth order and
its harmonics decreases down to 50%
of the amplitudes at design microgeometry
for high loads (see Figs. 4 and 6
details). Regarding gearbox B the excitation
of tooth order and its harmonics
increases to 150% of the amplitudes of
design microgeometry (see Figs. 5 and 7
details). The amplitudes of transmission
error with amounts of around 0.1 μm
are very small and the manufacturing
of the real gears will change the transmission
error only by 0.1 μm to 0.2 μm.
But in analyzing lower frequency excitation
there can be seen some additional
excitation due to manufacturing errors.
This additional excitation at low frequencies
is typical for calculation with
measured microgeometry data. In this
case the amplitudes of mesh excitation
for very low order increase up to 3 times
the value of 1st order of mesh excitation,
and even the 0.3 mesh order gets an
amount of 2 times 1st order amplitude.
This effect leads to the assumption that
manufacturing errors probably have significant
influence on excitation and will
excite some frequencies that are not in
tooth frequency.
Dynamic tooth force. Since the geometry
of shafts for gearbox A and B are
very similar, it is possible to perform
dynamic calculations for both with the same dynamic model. It consists of eight
rotational degrees-of-freedom. The gear
mesh stiffness is calculated internally by
DZP (Ref. 4) for every integration step.
For comparison, the resonance curves of
dynamic tooth force factor Kv have been
calculated. The dynamic tooth force factor
Kv with measured microgeometry for
gearbox A is clearly lower at resonance
frequency (2,400 rpm) than Kv with the
designed microgeometry. Looking at
gearbox B, the dynamic tooth force factor
at resonance frequency is higher for the
calculation with measured microgeometry
in comparison to the calculation with
nominal microgeometry; these results
match the transmission error results.
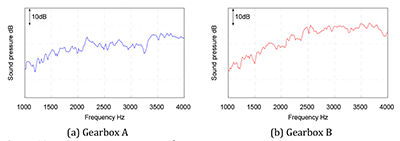
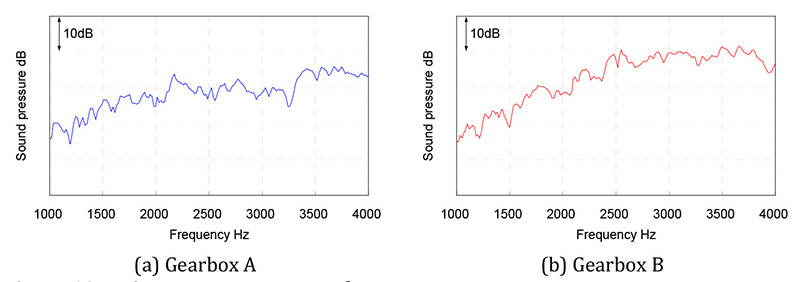
Figure 12 Noise measurement result.
- Click image to enlarge
All in all, calculation with design
microgeometry shows comparable
noise excitation of gearbox A and B. But
regarding measured microgeometry,
noise excitation of gearbox B is higher
than noise excitation of gearbox A.
Noise measurement results. In the production
facility, 100 gearboxes have been
tested on their airborne noise behavior.
Then the gearbox with the highest
noise level was measured on the same test
bench. The result of each type is shown
in Figure 12. Gearbox A (Fig. 12(a)) has
a broad frequency range of high noise
behavior between 2,000 Hz and 2,500 Hz.
For the gearbox B (Fig. 12(b)) there is
shown a constant increasing noise behavior
with higher frequency. Comparing the
curves, the noise of gearbox B is ultimately
higher than in gearbox A. This could
be reproduced by calculations with the
presented calculational method with the
program DZP (Ref. 4). It can be shown
that highly optimized design needs much
effort in manufacturing because small
deviations may have a big impact on
noise excitation.
Conclusion
In this paper a method for gear noise
prediction is presented. This method is
used in a comparison between the measurement
and calculation of gear noise
excitation for two automotive gearboxes.
After modelling the gear meshes with
their nominal main and microgeometry,
transmission error and dynamic tooth
force were calculated. In the first step the
mesh excitation of nominal and topologically
measured microgeometry was compared.
As a result the difference between nominal and measured microgeometry
had a significant impact on the excitation
behavior. In particular, highly optimized
microgeometry design needs much effort
in manufacturing because small deviations
in manufacturing may result in
major changes in noise excitation; noise
measurement results confirmed the
calculation. Additionally, the dynamic
behavior of shafts, bearings and housing
was addressed. The presented methodology
enables the gear engineer to optimize
the microgeometry of gears with respect
to their robust manufacturing
References
- Cooley, C., R. Parker and S. Vijayakar. “An
Efficient Finite Element Solution for Gear
Dynamics,” In: IOP Conf. Series: Materials
Science and Engineering, DOI:10.1088/1757-
899x/10/1/012150, 2010.
- Davoli, P., C. Gorla, F. Rossa, F. Rossi and G.
Boni. “Transmission Error and Noise Excitation
of Spur Gears,” In: Proceedings of the ASME
2007 10th International Power Transnmisson and
Gearing Conference, Las Vegas-DETC2007-34099,
2007.
- Forschungsvereinigung Antriebstechnik E.V. (FVA)
(Hrsg.): FVA-Heft Nr. 914: Ritzelkorrektur (Rikor),
Version I. Rikor I, 2009.
- Forschungsvereinigung Antriebstechnik E.V. (FVA)
(Hrsg.): FVA-Heft Nr. 937: DZP, Version 5.0 und
DZPopt, Version 2.0, 2010.
- Heider, M. “Schwingungsverhalten von
Zahnradgetrieben,” TU München, Diss. 2012.
- Gerber, H. “Innere Dynamische Zusatzkräfte bei
Stirnradgetrieben,” TU München, Diss., 1984.
- Schmidt, G. “Berechnung der Wälzpressung
Schrägverzahnter Stirnräder unter
Berücksichtigung der Lastverteilung,” TU
München, Diss., 1973.
- Velex, P., J. Bruyère and D.R. Houser.
“Some Analytical Results on Transmission
Errors in Narrow-Faced Spur and Helical
Gears — Influence of Profile Modifications,”
Journal of Mechanical Design, Vol. 133, No. 3,
(March 2011), p. 11, ISSN: 1050-0472.
- Weber, C. and K. Banaschek. “Formänderung
und Profilrücknahme bei Gerad und
Schrägverzahnten Rädern,” Bd. 11, Schriftenreihe
Antriebstechnik, Braunschweig: Vieweg Verlag,
1955.