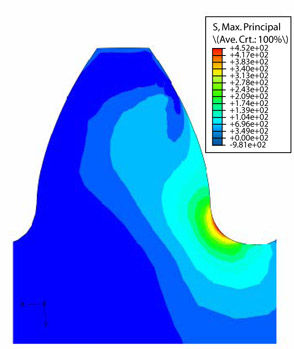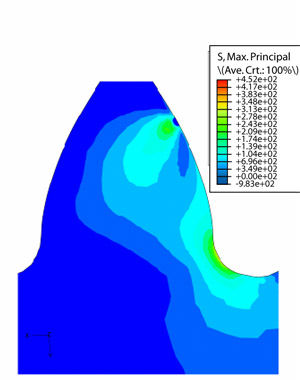
Figure 4--Maximum principal; stress contour plot in the side of the gear: Full-body gear with b = 20 mm
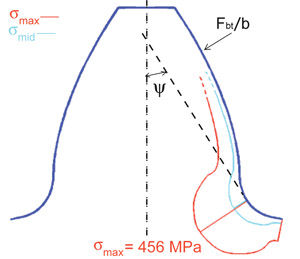
Figure 5--Maximum and intermediate principal stress distribution at the tooth root fillet in the middle cross-section: Full-body gear with b = 20 mm.
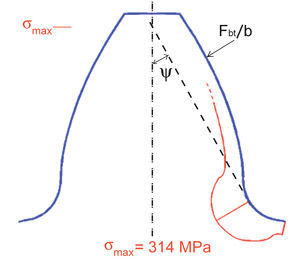
Figure 6--Maximum and intermediate principal stress distribution at the tooth root fillet in the sides of the gear: Full-body gear with b = 20 mm.
The highest value of the maximum principal stress in a cross-section--herein named bending stress--may be used to characterize the stress levels along the face width. Figure 7 shows the bending stress as a function of the distance z from the middle plane for gears having different face width. Two types of distribution can be recognized, as shown in Figure 8. For a b/m ratio lower than nine, the maximum of the bending stress is in the middle section and the minimum in the sides of the gear. The maximum is higher than the bending stress calculated in plane strain condition. For a b/m ratio higher than nine, the minimum bending stress is again in the sides of the gear, but the maximum is close to the sides, not in the center. In the middle cross-section, the bending stress approaches the plane strain value for face width close to infinity.
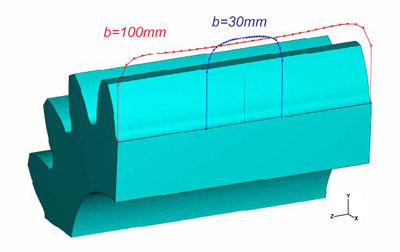
Figure 7--Bending stress distributions along the face width for full-body gears with b = 30 mm and b = 100 mm.
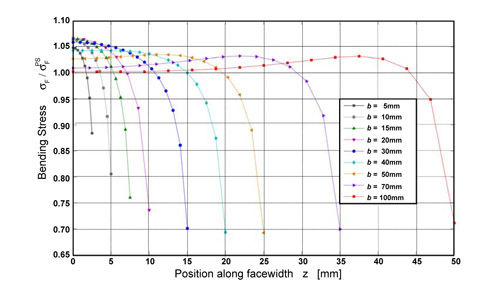
Figure 8--Bending stress distribution along the face width for different b: Full-body gear σF is the bending stress stress and σFPS is the bending stress in plane strain condition).
Thin-Rimmed Gears
A common design goal for gears in some power transmissions (e.g., aerospace transmissions) is reduced weight. To meet this goal, thin rims are often utilized. But rims that are too thin may adversely affect the bending stress. Several researchers have employed FEA for the purpose of assessing the influence of the rim thickness on the stress behavior in thin-rimmed gears. Yet most of these 2-D and 3-D analyses do not consider a web structure of the gear body. It is therefore believed that these models cannot give an accurate evaluation of the stress field at the tooth fillet of gears having a thin rim supported by a web.
A model of a spur gear pair is used here to evaluate the influence of both the rim and web thickness. In the geometrical model, the gear bodies are modeled as a thin rim supported by a web (Fig. 9). Nine different case studies are analyzed with all geometry parameters fixed, excepting the back-up ratio and the web thickness ratio (Table 1). The first, here referred to as r, is the ratio between the rim thickness SR and the tooth height. The second, referred to as w, is the ratio between the web thickness bS and the face width b.
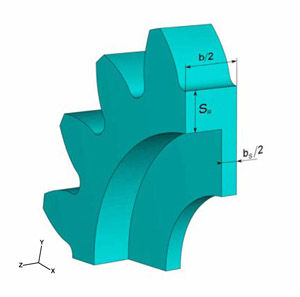
Figure 9--Thin-rimmed gear geometry.
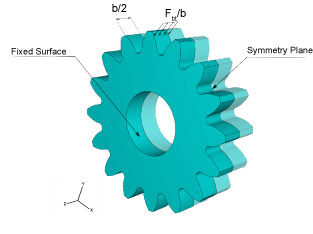
As opposed to the full-body gear case, the gear pair is modeled and the dry contact of the mating tooth surfaces is simulated by a numerical algorithm. The gear pair position is chosen to load the pinion tooth at the HPSTC, as in the full-body gear analyses. To impose kinematic and static boundary conditions, the pinion hub is fixed and the torque applied to the wheel hub (Fig. 10).
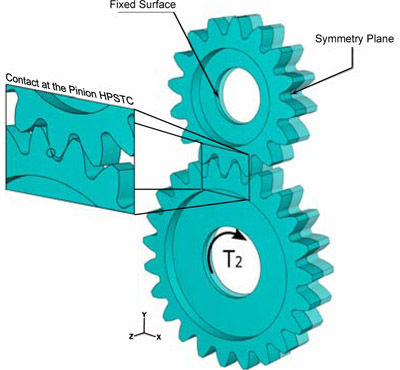
Figure 10--Geometric model and boundary conditions: Thin-rimmed gear.
The contact pressure distributions obtained from the numerical simulations were similar in all cases analyzed. The contact pressure was not uniformly distributed along the face width. In the middle section, the pressure distribution is close to the Hertzian distribution for the plane strain condition (Fig. 11). In the side sections, the contact pressure distribution is again elliptical, but the maximum value is lower than in the middle section. This reduction occurs due to the free expansion of the material on the sides of gear, contrary to the middle section. The ratio between the maximum contact pressure in the side and in the middle sections can be calculated according to Johnson (Ref. 6) as p/pH = (1-v2) = 0.91 (considering steel gears). This value is close to that obtained from the analysis p/pH = 0.88 (Fig. 11).
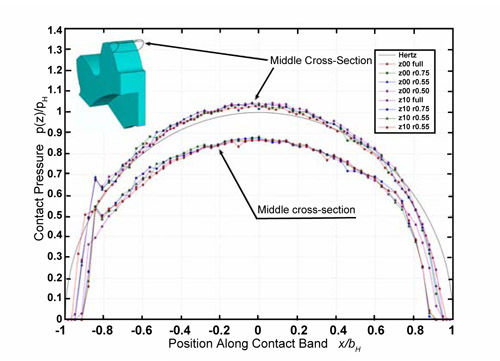
Figure 11--Contact pressure along the involute profile in the middle cross-section (z00) and in the sides of the gear (z10): Thin-rimmed gear with b=20 mm, w=0.3 and r=0.5, 0.65 and 0.75.
Considering the stress field at the tooth root, the results of the FEAs again show that the maximum bending stress is located in the central cross-section, and the minimum in the sides of the gear. But the difference between these two values is larger than in the full-body gear case. Moreover, the shapes of the maximum principal stress contour lines are different in the two positions along the gear width (Figs. 12 and 13). This is due to the differences between the stiffness of the central area--supported by the rim and the web--and the stiffness of the end areas which are supported only by the rim. As a consequence, the locations of the highest value of the maximum principal stress in the tooth fillet are also different in the two cross-sections; the location varies from 43° in the middle to 32° on the sides (Figs. 14 and 15).
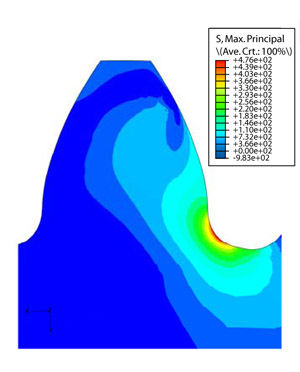
Figure 12--Maximum principal stress contour plot in the middle cross-section: Thin-rimmed gear with b = 20 mm, r = 0.65 and w = 0.3.
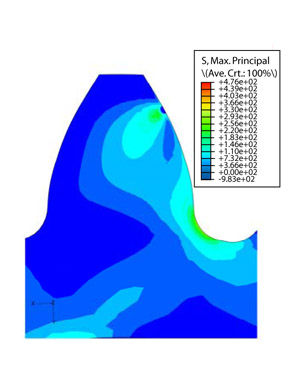
Figure 13--Maximum principal stress contour plot in the middle cross-section: Thin-rimmed gear with b = 20 mm, r = 0.65 and w = 0.3.
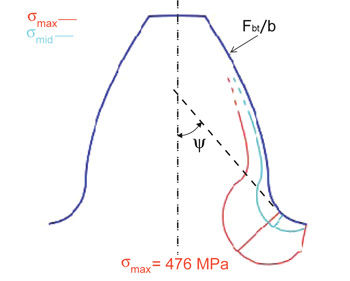
Figure 14--Maximum principal stress at the tooth root fillet in the middle cross-section: Thin-rimmed gear with b = 20 mm, r = 0.65 and w = 0.3.
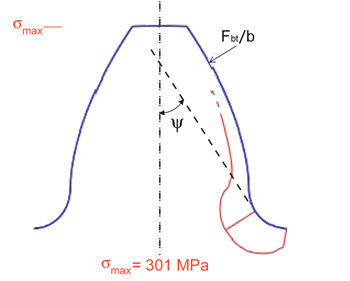
Figure 15--Maximum principal stress at the tooth root fillet in the middle cross-section: Thin-rimmed gear with b = 20 mm, r = 0.65 and w = 0.3.
In Figure 16, the bending stress is plotted as a function of the distance of the section from the middle plane for the nine case studies and for a full-body gear case. For back-up ratio equal to 0.75, the thin rim has a small influence on the bending stress, and the stress distribution is unaffected by web thickness ratio. If the back-up ratio decreases, the magnitude of the bending stress in the middle plane increases and the effect of the web thickness becomes clear--the increment of the bending stress becomes larger when the web thickness decreases (Fig. 16).
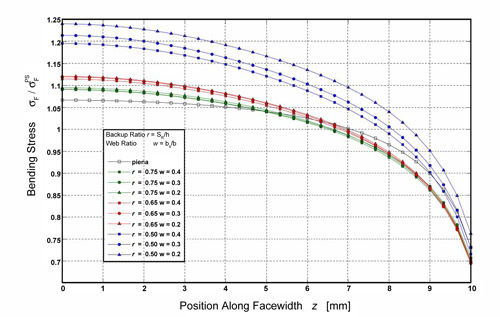
Figure 16--Bending stress distributions along the face width for different r and w: Thin-rimmed gear with b = 20 mm ( σF is the bending stress and σFPS is the bending stress in plane strain condition).
AGMA and ISO Thin-Rim Coefficients
Both the ISO and AGMA standards (Refs. 7 and 8) introduce stress-modifying factors for the bending stress
calculation where the rim thickness is not sufficient to provide full support of the tooth root. The AGMA and ISO rim thickness factors KB and YB have the same meaning and same values as a function of the back-up ratio.
According to the ISO standard, the rim thickness factor should be defined as the ratio of the nominal tooth root stress for a thin-rimmed gear and for a full-body gear with the same geometry but without the back-up ratio. The magnitude of the rim thickness factor can be derived from diagrams (Fig. 17) or calculated according to the ISO standard with this formula for an assigned backup ratio: YB = 1.6 ln (2.242 x ht /SR) per 0.5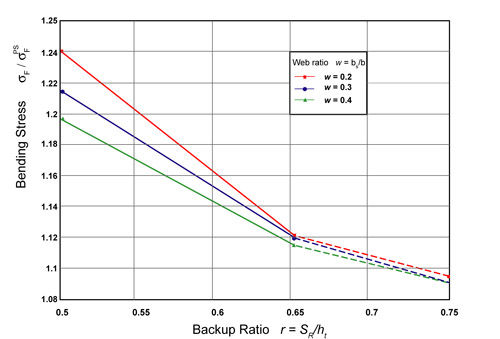
Figure 17--Ratio between the maximum bending stress and the bending stress in plane strain condition as function of the backup ratio for diffrent web thickness ratios.
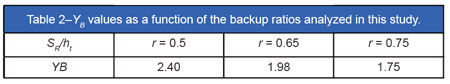
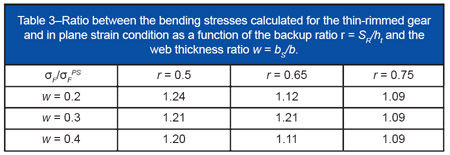
The values of the YB factor calculated for r = 0.5, 0.65 and 0.75 are listed in Table 2, while the ratio between bending stress for the full-body gear and the thin-rimmed gears investigated in this study are reported in Table 3. The differences between the values for a given r are large, but the effect of web is not taken into account in the YB factor. The values obtained have instead a good correlation with the results of numerical and experimental investigations described in Reference 5, where the effect of both the thin rim and the web thickness are considered.
Conclusions
This paper presents the results of an investigation on the variation of the tooth root stress field along the face width for full-body and thin-rimmed gears. The results of parametric, 3-D finite element analyses are used to characterize the influence of some significant geometric parameters on the bending stress distribution.
For full-body gears, the influence of the face width was investigated, showing areas with different stress levels along the tooth width. The results show that, for face width ratio close to practical gear design, most of the bending stress occurs in the center cross-section and the magnitude is higher than in the plane strain condition. The location in the tooth root fillet of the highest value of the maximum principal stress changes along the face width, but the values of the angle ψ are close to 30°.
For thin-rimmed gears, the influence of both rim and web thickness was investigated. The results show that for backup ratio values larger than 0.75, there is a very small influence on the tooth root stress, while the maximum fillet stress increases sharply as the backup ratio value is smaller than 0.75. Moreover, the more the web thickness is increased, the more the stress concentration factor decreases.
References
1. Wellauer, E. J. and A. Seireg, "Bending Strength of Gear Teeth by Cantilever-Plate Theory," Journal of Engineering for Industry, 1960.
2. Jaramillo, T. J., "Deflection and Moments Due to a Concentrated Load on a Cantilever Plate of Infinite Length," Journal of Applied Mechanics, vol. 17, Trans. ASME, vol. 72, 1950, pp. 67-72.
3. Shijun Ma and Chien-ann Hou, "The Crack Initiation of Spur Gear Tooth: Experiments and Analysis," International Gearing Conference, 1988.
4. Tsai S. J., and S. H. Wu, "Experimental and Numerical Root Stress Analysis of Conical Gears," International Conference on Gears, Muenchen, VDI Berichte, 2005.
5. Blazakis, C. A. and D. R. Houser, "Finite Element and Experimental Analysis of the Effects of Thin-Rimmed Gear Geometry on Spur Gear Fillet Stresses," International Gearing Conference, Newcastle-Upon-Tyne, 1994.
6. Johnson, K. L., Contact Mechanics, Cambridge University Press, 1985.
7. ISO 6336:2006 (E), "Calculation of Load Capacity of Spur and Helical Gears," ISO International Standard, 2006.
8. ANSI/AGMA 2001-C95, "Fundamental Rating Factors and Calculation Methods for Involute Spur and Helical Gear Teeth."
9. Hibbit, Karlsson & Sorensen, Inc. ABAQUS User's Manual, version 6.5.
Appendix
The numerical simulations were performed using ABAQUS version 6.5-1 in the pre/post processing (ABAQUS/CAE) and in the numerical analysis (ABAQUS/Standard).
The material was considered homogeneous and isotropic with a linear elastic behavior. Small displacement hypothesis was assumed for the analyses. In the full body gear analyses, hexahedral quadratic elements (3D) and bilinear quadrilateral (2D) elements fully integrated (ABAQUS codes C3D20 and CPE8 according to Ref. 9) were used for the domain discretization in the three- and two-dimensional models. In the thin-rimmed gears analyses, hexahedral linear elements (ABAQUS code C3D8I according to Ref. 9) were used for the mesh. These types of elements are suggested for the convergence of the contact algorithm and the elements are enhanced by incompatible modes to improve their bending behavior. The number of elements used was varied depending upon the particular gear width being considered.
In the analyses where the gear pair was simulated, the contact between the tooth surfaces was considered as a dry frictionless contact assuming small sliding between the surfaces. The contact constraint was simulated by the LaGrange Multiplier Method (i.e. using the ABAQUS option "Hard contact").