Another approach to the reduction in noise excitations at lower loads is to use what is called “short relief,” where the start of the modification is moved closer to the tooth extremes (Refs. 9 and 17).
In this scheme, it is possible to have zero transmission error at no load and still have a reduction of excitation at higher loads. However, the reduction at the design load will be much less than for the “long relief” method described above.
For narrow face width spur gears, correction in the face width direction is usually not used, but for medium-to-wide face widths, lead crowning may be needed in order to compensate for lead errors and misalignment. When lead crowning is used, one must reassess the scheme for determining the best modification.
Helical gearing. In order to get adequate benefits of the axial load sharing of helical gears, they usually have medium-to-wide face widths that likely require some lead crowning in order to compensate for misalignment. Many gear researchers (Refs. 18–27) have shown the effects of crowning shape and amplitude on load distribution. In each instance it was shown that for a given level of misalignment, there is a range of crowning that will provide a reduction in the peak root and contact stresses, and will shift the peak stresses from the edge of the tooth to the center.
However, it was also shown that while excessive crowning can certainly shift the peak contact stress closer to the center of the tooth, it will also result in an increase in the peak contact stress due to the concentration of load in the center of the crown region. These investigators, however, seldom mentioned the effects of crowning on gear noise excitation.
Numerous investigators have de-veloped schemes for creating optimum modifications for helical gears, most of them based on the minimization of transmission error. Several researchers (Refs. 28–32) have developed methods for simultaneously studying the profile and lead modifications of helical gears. Umezawa’s (Ref. 30) performance diagram that allows the study of many variables is similar to what is done in this study, but his emphasis was much more related to the best gear geometries to minimize dynamics.
Finally, it has been shown that it is possible to obtain a zero-transmission-error surface topography for any gear pair (Ref. 33). Constraints are that the method will work at only one load, and it requires that the load distribution be defined beforehand. In addition, the modifications that result have peculiar shapes that would be difficult to manufacture.
Load Distribution Analysis Procedure
When considering topographical modifications and misalignment effects on the performance of gearing, it is necessary to have a computation procedure that determines the load distribution along the lines of action of the gears. In this paper, the basis of the load distribution analysis comes from the research of Conry and Seireg (Ref. 34). However, similar approaches have been used by a number of investigators (Refs. 35–37). The work of Conry and Seireg has led to the creation of a computer program called the Load Distribution Program (Ref. 38) at the GearLab at The Ohio State University. Unlike general purpose, finite element approaches that are often used for this type of analysis, the approach used here is—computationally—extremely fast, allowing the performance of numerous simulations in a short time. Microgeometry modifications can be applied to the load distribution solver by treating them as the initial separation of the gears in mesh. A brief discussion of the bases of this program is provided in an annex at the back of this paper.
Outline of Procedure of Topographical Modifications
The following is an outline of the graphical procedure that is used to come up with optimal modifications. This procedure essentially allows the user to observe the effects of any of a number of response variables, such as root and contact stresses; noise excitations such as transmission error and sum-of-forces; and tribology properties such as surface temperature and film thickness. Sum-of-forces is the sum of the first harmonic of transmission error, shuttling force and friction force (Ref. 39). The effect of any of these variables may be viewed as a function of torque in a number of ways. The designer now has the opportunity to select the modification that can provide adequate noise response over a broad range of loads while at the same time satisfying load distribution, contact stress and bending stresses requirements at the higher loads. The final process of the evaluation is to perform a manufacturing sensitivity analysis to check the design’s sensitivity to random errors in manufacturing and assembly, such as housing misalignment, lead and profile errors.
1. Select two design variables and their ranges. Possibilities include profile crown, profile slope, tip relief, lead crown, misalignment, shaft deflection and bias modification.
2. Select evaluation torques and run the load distribution program.
3. Select design evaluation metrics (transmission error, sum-of-forces, contact stress, bending stresses, surface temperature and film thickness).
4. Create a 2D parameter map, and move the cursor around on the appropriate evaluation metrics map at the selected torque until the user achieves a desirable torque response for that pair of variables. One may repeat this selection to compare the performance of various combinations of these variables. At each selection, a graph versus torque will be made for that variable and each selection is superimposed on the same graph. One may look at other design metrics and then select the composite “best” design or designs.
5. With the chosen values of the design variables, select two additional design variables and repeat the above procedure. One may need to iterate on the original variables upon completion of initial evaluations, but generally, iteration is not required.
6. Perform robustness analysis of the selected designs.
Procedure Example
The procedure is quite flexible in the order in which variables are analyzed and in the number of variables that are considered. Therefore, an example of only one procedural possibility is presented. Usually, it was found that the most important variables should be dealt with in the early steps. One approach to rank ordering the importance of the design variables is with a Taguchi-type, factorial design analysis (Ref. 40).
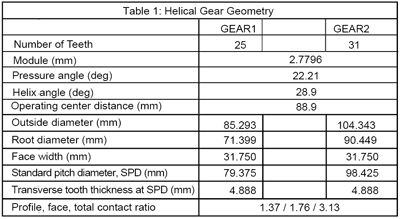
In the example that is shown below, a helical gear pair that was designed and tested by NASA (Ref. 41) will be optimized to minimize noise excitations at a range of pinion torques between 100 and 250 Nm (mean value is 175 Nm). The rated design torque for these gears is roughly 400 Nm. Figure 1 shows a transverse plane schematic of the gears in mesh. Table 1 presents a summary of the geometry of this gear pair.

Figure 1—Schematic of Gears in Mesh.
Selection of lead crown to compensate for misalignment. There are essentially three types of decisions that are made regarding the selection of lead crown, including:
1. Use none; this may be done for narrow face widths or when extremely accurate manufacturing methods are used.
2. Use company-specified standards that are based on company experience.
3. Establish the amount of peak misalignment and perform a load distribution analysis to establish a level of crown that shifts the peak load from the tooth edge. Usually this evaluation is done at the design load since the goal is to control the root and contact stresses.
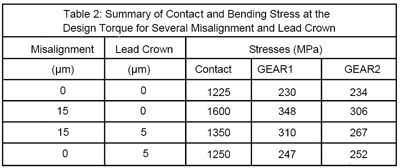
Here, the latter situation will be demonstrated. One method is to use an AGMA-quality number as a reference. For example, AGMA A8 quality will be assumed to establish the manufacturing misalignment. This number will be doubled in order to account for the misalignment due to the housing, giving a peak misalignment of 15 µm across the face width of the gear set. Because of the relatively narrow face width of the gear pair, circular lead crowning will be applied so that the contact stresses and root stresses do not peak at the edge of the gear. Figure 2 shows the typical contact stress without any misalignment (peak at 1,225 MPa). Figure 3 shows the contact stress of the misaligned part (peak at 1,600 MPa). Figure 4 shows the contact stress of the misaligned part with 5 µm of lead crown (peak at 1,350 MPa). One can see that for this 5 µm lead crown, the contact stresses at the edge are avoided. In each case, a sharp profile tip modification is applied so that the high stress at the corner of the tip and root can be reduced or ignored. Table 2 shows contact stress and bending stresses for different misalignment and lead crown.
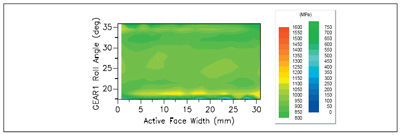
Figure 2—Contact Stress at 400 Nm (No Misalignment).

Figure 3—Contact Stress at 400 Nm (With Misalignment).

Figure 4—Contact Stress at 400 Nm (5.07 µm Lead Crown and 15.23 µm Misalignment).
Another method is to use the 2D parameter maps of contact stress and bending stress for lead crown versus misalignment, as shown in Figure 5. This method could be used to establish the appropriate lead crown needed at known misalignment values. Using this method, it would seem like the best lead crown would be about 7 µm for contact stress and about 10 µm for bending stress.

Figure 5—Interaction of Misalignment and Lead Crown at Design Torque (400 N-m).
In the next stage of the analysis, the interactions between lead crown and profile crown will be performed for perfectly aligned teeth.
Profile crown and lead crown interactions. Experience has shown that circular crown provides nearly optimal modification for the minimization of transmission error of helical gears. Beside that, profile crown and lead crown are the two most important variables in minimizing transmission error. Thus, it is logical that they are the first variables to be considered when minimizing transmission error.
In this case, standard parameter maps were generated for lead crown and profile crown amplitudes from 0–50 µm.
Maps of peak-to-peak transmission error for six torque levels are shown in Figure 6. One may traverse any of the parameter maps with a mouse cursor and by clicking it, one may select any combination of profile and lead crowns. Then one can plot any of a large number of gear design metrics (transmission error, sum-of-forces, contact stress, bending stress, etc.) versus torque for that combination of crowns. Each time a new combination is clicked, a new set of torque plots will be superimposed on the plots of design metrics.
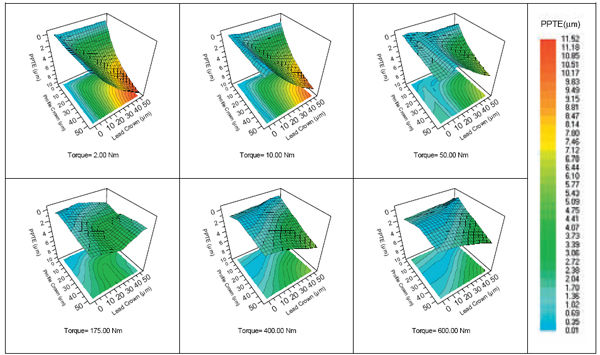
Figure 6—Peak-to-Peak Transmission Error for Profile Crown and Lead Crown Modification.
One example—Figure 7—shows such a set of plots with the letters A, B, C, D and E being the selected pairs. From the peak-to-peak transmission error versus torque plots, we see that each of the crowning pairs gives a minimum transmission error at a different torque. The second noise metric—sum-of-forces—is less clear with regard to the minimum values; but if the procedure is repeated using the sum-of-forces parameter map, one might have found better minimum values for this variable.
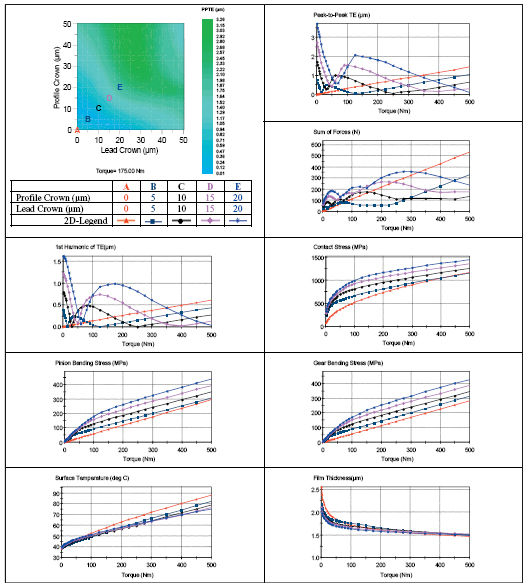
Figure 7—Interaction of Selected Profile Crown and Lead Crown to Several Gear Design Metrics.
The remaining plots show how the other design metrics respond to the increasing profile and lead crowning. Usually, as we increase crowning, stresses go up since loads are being concentrated more in the center region of the tooth-meshing zone.
Since the center of the noise torque region is at 175 Nm, we will try to find the profile crown and lead crown that would minimize the peak-to-peak transmission error at this torque and its surrounding torques. Figure 8 shows the profile crown and lead crown (AB, AC, AD and AE) that are used for the next runs that are used to select the second-order tooth modifications.
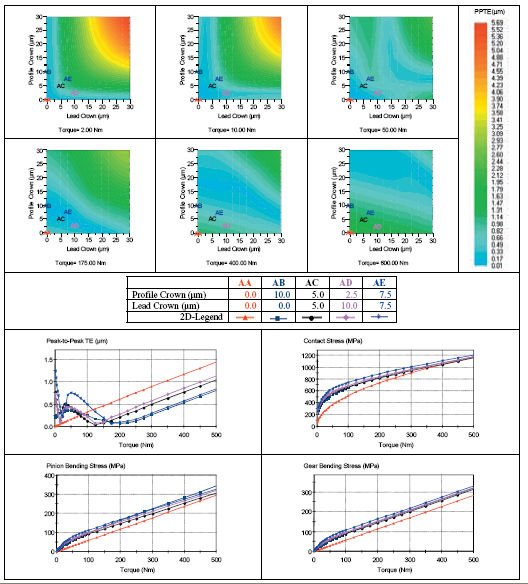
Figure 8—Several Gear Design Metrics Results using Selected Profile Crown and Lead Crown Modifications.
Profile slope and lead slope interactions. The next step is to use the selected cases from profile crown and lead crown (AB, AC, AD and AE) and evaluate the interaction of profile slope and lead slope from –25 to 25 µm.
Figure 9 shows the peak-to-peak transmission error for case AE. At one torque, changing the profile slope and lead slope interaction may improve the design matrix, while the reverse may be true at other torque. The behavior of one torque might be different at another torque. For example, at 50 Nm, one could see that for –10 to 10 µm lead slope, one could select a large range of profile slope. However, at 400 Nm torque value, increasing lead slope and increasing profile slope are required to have low peak-to-peak transmission error. The user could move around the mouse cursor to find the relationship of profile slope and lead slope. Here cases AE0, AE1, AE2, AE3 and AE4 will be chosen.
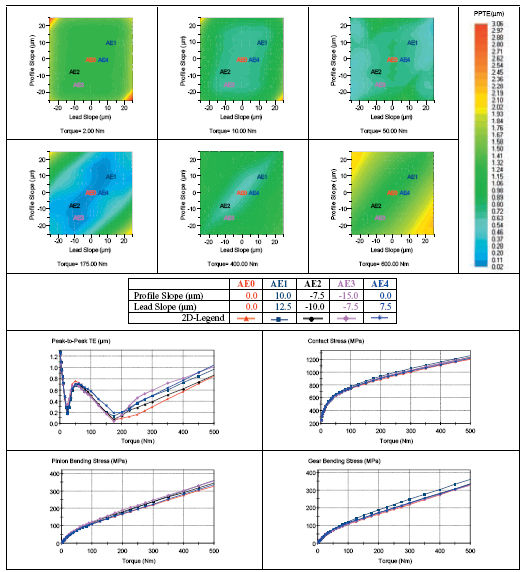
Figure 9—Peak-to-Peak Transmission Error for Varying Profile Slope and Lead Slope with a Fixed 7.5 µm Profile Crown and 7.5 µm Lead Crown (Case AE).
Although not shown here, a similar procedure is used for the other cases (AB, AC and AD). Thus, the selected designs would have their own profile crown, lead crown, profile slope and lead slope. By and large, the profile slope and lead slope modifications do not have much effect on the transmission error results, but in a couple of instances, some improvements were observed. It is interesting to note that the maximum transmission error across the entire torque region is about 1.25 µm. To reduce the next interaction study (bias modifications), one or two of each
main case are used, which is shown in Figure 10.
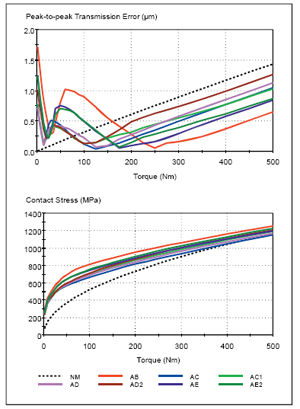
Figure 10—Stacking Selected Cases.
There are a total of seven selected designs—AB0, AC0, AC1, AD0, AD2, AE0 and AE2.
Bias modification interactions. Bias modifications (twist in the tooth shape) from –7.5 to 7.5 µm are used for the next procedure. “Bias out” modifications remove more material from the entering and leaving regions of contact, and “bias-in” modifications remove material from the opposite corners of the teeth. Table 3 shows the bias that was added to the earlier modifications. Figure 11 shows the schematic on applying the bias modification in the load distribution program.
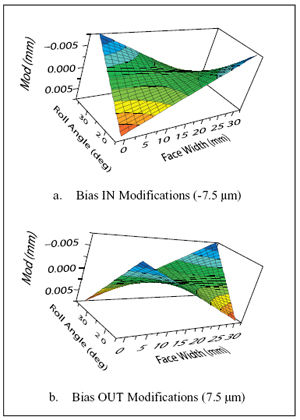
Figure 11—Bias Modification on GEAR1.
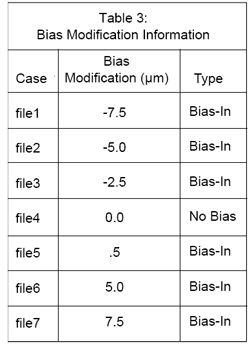
Figure 12 shows the effect of bias modification of several design metrics for case AE0. Here, adding bias-in modification seems to improve the peak-to-peak transmission error and sum-of-forces, and at the same time it does not increase the contact stress from the no-bias case. For this particular case, –5 µm (bias-in, case AE02), seems to be the best selection. The same procedure is done (not shown here) for all other cases and the bias modifications are selected that optimize the design metrics.
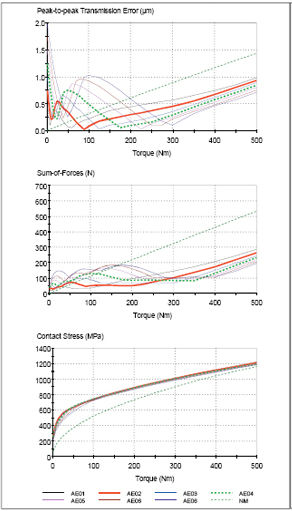
Figure 12—Effect of Bias Modifications (-7.5 to 7.5 µm) to Case AE (7.5 µm Profile Crown, 7.5 µm Lead Crown, 0.0 µm Profile Slope, and 0 µm Lead Slope.)
Figure 13 shows the comparison of these selected modifications. Cases AC03 and AD02 seem to be the better modification, when compared to other cases from the peak-to-peak transmission error point of view at noise torque ranges. However, cases AB02 and AE02 seem to be the better modification compared to other cases from the sum-of-forces point of view. Case AC03 seems to be the better modification to the other cases from a contact stress point of view. Bending stresses show similar results as the contact stress (not shown here). Figure 14 shows the baseline modification for each selected modification. Thus, the gear designers would need to compromise between the noise and stresses for the modification to be used as a baseline. Next step would be to analyze which of these modifications are less sensitive to manufacturing error (robustness analysis).
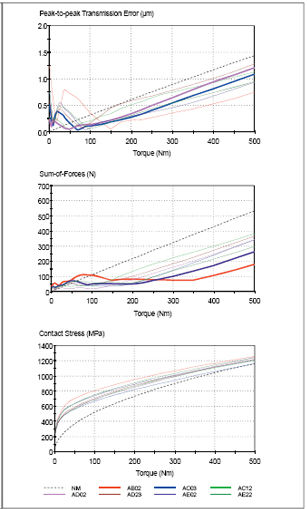
Figure 13—Summary Results of Selected Design.
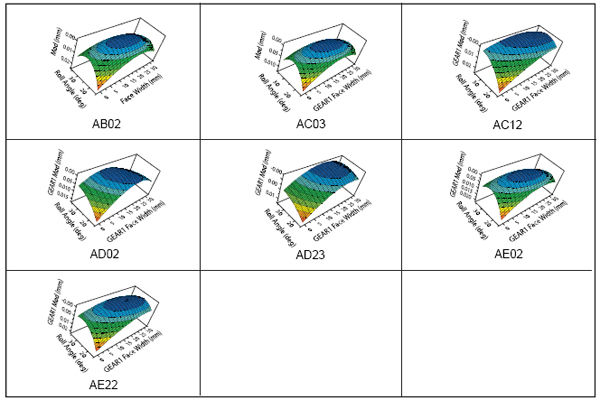
Figure 14—Total Modification For Selected Case.
Robustness analysis. Robustness analysis is a Monte Carlo-type simulation (Ref. 42) that applies randomly selected errors to profile slope, profile curvature, lead slope (includes misalignment), lead curvature and bias modifications. In this analysis, the standard deviation of each variable is created from the AGMA A8 accuracy specifications by which 100 manufacturing errors are selected randomly from the normal distributions for the gear. The distributions of errors of each of the variables are shown in Figure 15. Then, load distribution simulations are performed from low to high torque values.
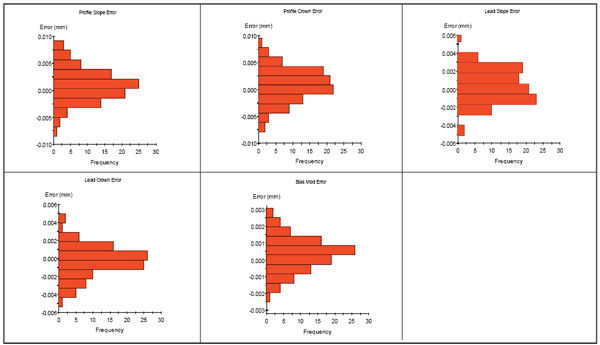
Figure 15—100 Random Samples of Manufacturing Error.
Results are shown for each design metric in Figures 16–20. Results are shown in terms of the average value of each 100 simulations and the mean-plus-three standard deviations (Aver+3Stvd), which gives an indication of the worst-case situation. Designs AB02, AE02 and AE22 each have transmission error average values that do not exceed 0.5 µm over the noise design torque range, and the same design’s mean-plus-three values stay under 1 micron for the same torque range.
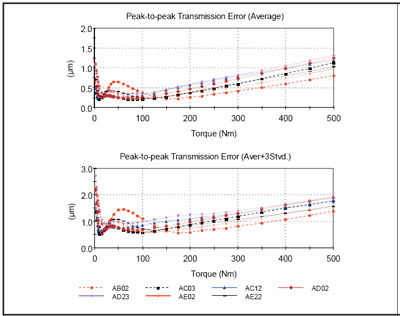
Figure 16—Robustness Analysis (Average and Aver+3 Stvd) for Peak-to-Peak Transmission Error.
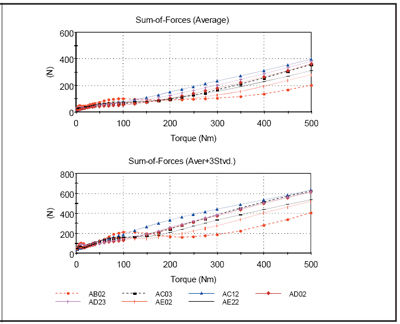
Figure 17—Robustness Analysis (Average and Aver+3 Stvd) for Sum-of-Forces.
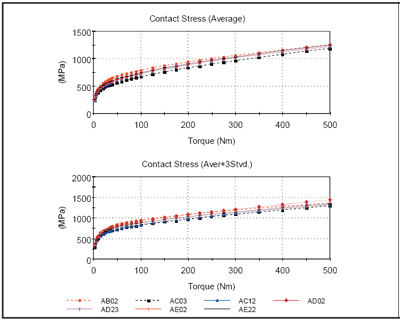
Figure 18—Robustness Analysis (Average and Aver+3 Stvd) for Contact Stress.
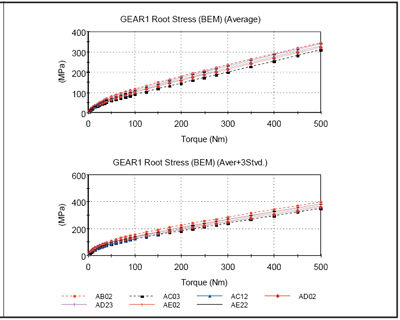
Figure 19—Robustness Analysis (Average and Aver+3 Stvd) for GEAR1 Bending Stress.
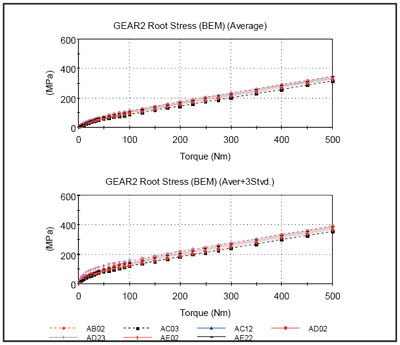
Figure 20—Robustness Analysis (Average and Aver+3 Stvd) for GEAR2 Bending Stress.
From a sum-of-forces viewpoint, the design AB02 data seems to be the best. For these designs, the AC03 design has the lowest root and contact stresses. The topography for these designs is provided in Figure 14.
Summary
This paper has presented an interactive, graphical procedure for determining gear tooth topography designs that minimize the noise and stresses of gears. The method is also a valuable educational tool for understanding the effects of numerous topographical changes of the tooth surface on gear performance.
For the example helical gears, the following conclusions may be drawn:
1. Lead crown to adequately com-pensate for the misalignment is from 1/2 to 1/3 of the amount of misalignment across the face width.
2. Minimizing root stress requires a greater lead crown than does minimizing contact stress.
3. Profile and lead crown are the most important modifications for minimizing transmission error.
4. Profile slope and lead slope corrections have little effect on transmission error (shaft deflections are not considered here).
5. Bias modifications provide some improvements in transmission error over the noise design torque range, but the type of bias that is used depends upon the initial values of profile and lead crown.
6. Designs that are best for the perfect gear set are usually also the most robust gear designs.
In the future, there is a desire to apply these techniques to a broader range of gear geometries to see if the above conclusion can be extended to a broader range of gear geometries.
Acknowledgments
The authors would like to thank the sponsors of the Gear Dynamics and Gear Noise Research Laboratory (GearLab) at The Ohio State University for their support of the development of the modeling procedures used for the gear analyses presented in this paper.
References
1. Collins, L.J. “Gears—Their Applications, Design and Manufacture.” AGMA, 1947.
2. Walker, H. “Gear Tooth Deflection and Profile Modification.” The Engineer, Vol. 166, pp. 409–412. Oct. 14, 1938.
3. Walker, H. “Gear Tooth Deflection and Profile Modification—Part 2.” The Engineer, Vol. 166, pp. 434–436, Oct. 21, 1938.
4. Dudley, D.W. “Modification of Gear Tooth Profiles.” Sept. 20, 1949, pp. 126–131.
5. Dudley, D.W. “Handbook of Practical Gear Design.” McGraw Hill Book Company, NY, 1984.
6. Weber, C., K. Banaschek and G. Niemann. “Shape Changes and Tip Relief for Spur and Helical Gears.” Schriftenreihe Antriebstechnik, 1953.
7. Sigg, H. “Profile and Longitudinal Corrections on Involute Gears.” AGMA Paper 109.16; Chicago, Oct., 1965.
8. National Broach and Machine Div. “Modern Methods of Gear Manufacture.” Fourth Edition, 1972.
9. Munro, R.G., N. Yildirim and D.M. Hall. “Optimum Profile Relief and Transmission Error in Spur Gears,” Proceedings I. Mech. E. Gear Noise and Vibration, Cambridge, 1990.
10. Remmers, E.P. “Analytical Gear Tooth Profile Design.” ASME Paper No. 72-PTG-47, 1972.
11. Welbourn, D.B. “Fundamental Knowledge of Gear Noise—A Survey. Proceedings I. Mech. E. Conference on Noise and Vibrations of Engines and Transmissions, Cranfield Institute of Technology, July, 1979.
12. Lin, H.H., F.B. Oswald and D.P. Townsend. “Dynamic Loading of Spur Gears with Linear or Parabolic Tooth Profile Modifications.” Mechanism and Machine Theory, 1994; 29 (8), pp. 1115–1129.
13. Tavakoli, M. S. and D.R. Houser. “Optimum Profile Modifications for the Minimization of Static Transmission Errors of Spur Gears.” Journal Mechanics Transmission, ASME, Vol. 108, pp. 86-95, March, 1986.
14. Houser, D.R. “Transmission Error Modeling.” Seminar: Plastic Gear Fundamentals Design and Manufacturing, Rosemont, IL, April 26–27, 2005.
15. Niemann, G. and J. Baethge. “Drehwegfehler, Zzahnfederharte und Gerdusch bei Stirnradern.” DI-Z, Vol. 112, No. 4 and No. 8.
16. Wyeth, M. and W. Rouverol. “Differential Crowning: A New Weapon Against Gear Noise and Dynamic Load.”AGMA, 1996.
17. Palmer, D., and R.G. Munro. “Measurements of Transmission Error, Vibration and Noise in Spur Gears.” Proceedings, I. Mech. E. Gear Dynamics Conference, 1995.
18. Tobe, T., and K. Inoue. “Longitudinal Load Distribution Factor of Helical Gears.” J Mech. Trans. and Auto. in Design, Vol. 107, 1985.
19. Wingate, D., and R. Walsh. “Evaluating the Load Distribution Factor for Spur Gears.” SAE Paper 891930, Milwaukee, 1989.
20. Sainsot, V. and D. Berthe. “A Static and Dynamic Analysis of Misaligned Gears with Partial Contact.” Proceedings of the 15th Leeds-Lyon Symposium on Tribology, Univ. of Leeds, UK, pp. 167–172, 1988.
21. De Vaujany, Jean-Pierre. “Axis Misalignments and Crowning for Helical Cylindrical Gears.” 4th World Congress on Gearing and Power Transmission; Paris, France, 1999.
22. Chang, S., D.R. Houser and J. Harianto. “Tooth Flank Corrections of Wide Face Width Helical Gears that Account for Shaft Deflections.” Proceedings of the 9th International Power Transmission and Gearing Conference, Chicago, IL, 2003.
23. Linke, H. and M. Senf. “Breitenlastverteilung bei Verzahn-bungen—Berechnung und Diskussion Longitudinal Load Distribution in Gearing—Calculation and Discussion.” Maschinenbautechnik, Vol. 32, No. 10, pp. 437–444, 1983.
24. Hösel, T.H. “Calculation of Contact Pattern and Longitudinal Flank Correction in Spur and Helical
Involute Gears.” Proceedings 6th World Congress on the Theory of Machines and Mechanism, New Delhi, 1983.
25. Fujita, K. “Gear-Tooth Stress Calculation Method for Heavily Crowned Gear.” JSME, Vol. 17, No. 104, pp. 264–272, Feb., 1974.
26. Umezawa, K., T. Suzuki, H. Houjoh and K. Bagiasna. “Influence of Misalignment on Vibration of Helical Gear.” Proceedings 2nd World Congress on Gearing, Paris, pp. 615–626, 1986.
27. Guilbault, R. “Effects of Helical Slope and Form Deviation on the Contact and Fillet Stresses of Helical Gears.” AGMA Technical Conference.
28. Umeyama, M. “Effects of Modified Tooth Surface of a Helical Gear Pair on the Transmission Error and its Optimal Design.” International Gearing Conference, University of Newcastle, Tyne, UK, p. 377, 1994.
29. Maki, H. “A Study on Optimum Tooth Modifications of Helical Gears under Various Loads.” Proceedings of the Transmission and Driveline Systems Symposium, SAE, pp. 257–261, 1999.
30. Umezawa, K. “Low Vibration on a Helical Gear Pair.” AGMA Technical Paper, 98FTM5, 1998.
31. Honda, S. “Rotational Vibration of a Helical Gear Pair with Modified Tooth Surfaces, (Modified Tooth Surface and its Equivalent Tooth Profile).” JSME International Journal Series C-Dynamics Control Robotics Design and Manufacturing, pp. 125–134, 1993.
32. Matsumura, S., K. Umezawa, and H. Houjoh. “Performance Diagram of a Helical Gear Pair Having Tooth Surface Deviation During Transmission on Light Load.” Proceedings 7th ASME Intl. Power Trans. and Gearing Conf., San Diego, pp. 161–168, 1996.
33. Regalado, I. and D.R. Houser. “Profile Modifications for Minimum Static Transmission Error in Cylindrical Gears.” Proceedings ASME Design Engineering Technical Conference, Atlanta, 1998.
34. Conry, T.F. and A. Seireg. “A Mathematical Programming Technique for the evaluation of Load Distribution and Optimal Modifications for Gear Systems.” ASME Journal of Engineering for Industry, Vol. 94, July, 1972.
35. Kubo, A. “Stress Condition, Vibrational Exciting Force, and Contact Pattern of Helical Gears with Manufacturing and Alignment Errors.” Journal Mech. Des., Trans. ASME., Vol. 100, pp. 177–184, Jan., 1978.
36. Borner, J., N. Kurz and F. Joachim. “Effective Analysis of Gears with the Program LVR—Stiffness Method).” Intl. Conference on Gears, Munich, pp. 721–735, March, 2002.
37. Krenzer, T.J. “Tooth Contact Analysis of Spiral Bevel and Hypoid Gears Under Load.” SAE Paper 810688, 1981.
38. Load Distribution Program Manual, GearLab—The Ohio State University, 2002.
39. Houser, D.R. and J. Harianto. “Manufacturing Robustness Analysis of the Noise Excitation and Design of Alternative Gear Sets.” SAE Technical Paper, May, 2001.
40. Ueda, Y. and D.R. Houser. “Optimum Design and Manufacturing Robustness for Gear Whine of Helical Gears,” Proceedings International Conference on Gears and Transmissions, Munich, Germany.
41. Houser, D.R. “Gear Noise Sources and Their Prediction Using Mathematical Model.” Gear Design (AE-15) Manufacturing and Inspection Manual, Chapter 16, Society of Automotive Engineering, pp. 213–222, 1990.
42. Houser, D.R. and J. Harianto. “A Gear Design Optimization Procedure that Identifies Robust, Minimum Stress and Minimum Noise Gear Pair Designs.” 02FTM11, Technical Paper, AGMA, 2002.
Jonny Harianto is a Senior Research Engineer in the Department of Mechanical Engineering at The Ohio State University. He has a Master’s degree in Mechanical Engineering with a specialization in gearing systems. Mr. Harianto develops and enhances gear analysis computer software for the Gear Dynamics and Gear Noise Research Laboratory (GearLab), which is an industrially sponsored research consortium currently comprised of more than 45 companies. He also provides training and support of GearLab software to both consortium members and current GearLab graduate students. Mr. Harianto has been co-author of several gearing technical papers.
Professor Emeritus Donald Houser received his BS, MS and PhD degrees from the University of Wisconsin in Madison. He served on the faculty of the Department of Mechanical Engineering at Ohio State for 35 years. Dr. Houser is founder of the Gear Dynamics and Gear Noise Research Laboratory (GearLab), an industrial research consortium that currently has over 45 participating companies. He has supervised over 115 graduate student theses and has consulted on gearing problems with over 50 companies. Professor Houser has authored over 130 publications, most of them in the gearing area.
Annex
Formulation of the Load Distribution Calculation Procedure
The formulation of the solution of the load distribution (Ref. 1) in gears is equivalent to the formulation of the solution of the generalized, elastic contact problem. The discussion that follows is a condensation of the work of Conry and Seireg (Ref. 2) pertaining to elastic bodies in contact. Given the compliance of each point in the contact zone—the initial separations (or approaches) under zero-load and the applied load—the load distribution and the overall system rigid body rotation may be obtained using a modified, Simplex-type algorithm.
All elastic deformations and forces are assumed to be acting along the line of action in the transverse plane. For the gear teeth to be in contact at any point, the sum of the elastic deformations and initial separations must be equal to the rigid body displacement of the point with respect to the reference line. To determine the position of contact, the gear teeth are taken to be of perfect, involute form. Any tooth surface errors are interpreted as initial separations or approaches.
Two criteria are proposed for the mathematical formulation of the solution of the contact problem. The condition of compatibility of deformation outlines the condition for which points may come into contact. The condition of equilibrium assures that the sum of torques acting on the system are zero.
For any point, k, in the contact zone, the total sum of elastic deformations and initial separations must be greater than, or equal to, the rigid body approach along the line of action. This condition may be written as:
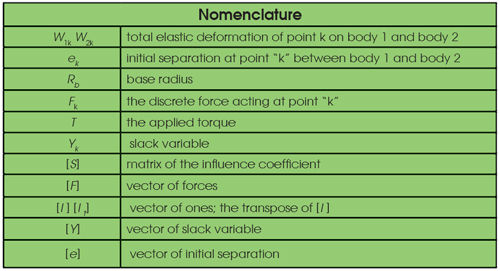
W1k +W2k + ek ≥ Rbθ (1)
The sum of all torques acting on a gear body must be zero. The sum of moments about the line of action must be equal, but opposite in sign, to the applied torque. This condition is represented as:
Σ (Fk x Rb ) + T = 0 (2)
The compatibility conditions as defined by the inequality equation (1) may be transformed into an equation of equality through the introduction of a slack variable, Yk. Equation 1 may now be written as
W1k + W2k + ek – Rbθ – Yk=0 (3)
Consequently, if Yk > 0, then the two bodies are not in contact at point k and Fk = 0. If Yk = 0, then contact exists and Fk ≥ 0. Thus, the solution to the load distribution problem may be stated as follows
− [S][F]+ Rbθ [i] + [I ][Y]− [e] = 0 (4)
[I t] + [F]Rb + T = 0 (5)
A modified Simplex type algorithm is then used to solve for the load distribution.
The major assumptions that are used in the load distribution calculation are:
1. All contact is along the line of action. This assumption does not allow so called “corner” contact that occurs when the modifications are not sufficient to compensate for tooth deflections as teeth enter and leave contact. There is a corner contact option that does allow this to be included for both spur and helical gearing (Ref. 3).
2. The edges of helical gear teeth are modeled as being perpendicular to the normal plane.
3. Rims and webs are assumed to be solid.
4. Tooth bending and shear de-flections are computed using a Rayleigh-Ritz solution of a tapered plate model (Ref. 4).
5. Additional tooth deflection com-ponents include Hertzian deflections (Ref. 5) and deflection of the tooth base (Ref. 6).
References
1. Load Distribution Program Manual, GearLab—The Ohio State University, 2002.
2. Conry, T.F. and Seireg, A., “A Mathematical Programming Technique for the evaluation of Load Distribution and Optimal Modifications for Gear Systems.” ASME Journal of Engineering for Industry, Vol. 94, July 1972.
3. Singh, A., and D.R. Houser. “Analysis of Off-Line of Action Contact at the Tips of Gear Teeth.” SAE Paper 941716.
4. Yau, E., Busby, H. and D.R. Houser. “A Rayleigh-Ritz Approach for Modeling the Bending and Shear Deflections of Gear Teeth.” JSME International Conference on Motion and Power Transmission, 1991.
5. Weber, C. “The Deformations of Loaded Gears and the Effect on Their Load-Carrying Capacity.” Sponsored Research (Germany), British Dept. of Scientific and Industrial Research, Report No. 3, 1949.
6. Stegemiller, M. E. and D.R. Houser. “A Three-Dimensional Analy-sis of the Base Flexibility of Gear Teeth.” ASME 5th International Power Transmission and Gearing Conference, Vol. 1, pp. 189–196, April, 1989.


