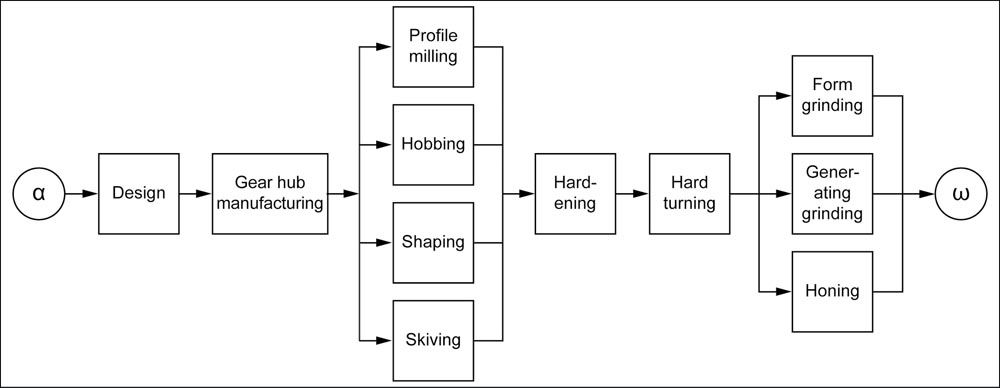
Figure 2—Customary production process for cylindrical gear manufacture.
Usually, the design department designs a gear with little discussion about the production. If the production is outsourced, as is often the case nowadays, during the design phase usually no decision is taken as to who will produce the gears, or which process will be used.
Taking the production methodology into consideration during the design process
Every production method (Figure 2) has its own specific properties that either enable the method to produce a particular tooth modification well, reasonably well or not at all. The machine operator in the production is faced with the problem of producing a modification that cannot be created mathematically exact. Consequently, the required modifications are produced with an approximation which is more or less good. If the operator then succeeds in creating the gear within the specified tolerance, he is happy with that. Deviations from the required modifications are checked during production with profile and flank line measurements. This process is of limited use for checking topological modifications. A reasonable tolerance interval is necessary for gear production, otherwise the production costs may become excessive. The question remains, if a gear produced inside the given tolerances will have the gear properties intended by the designer.
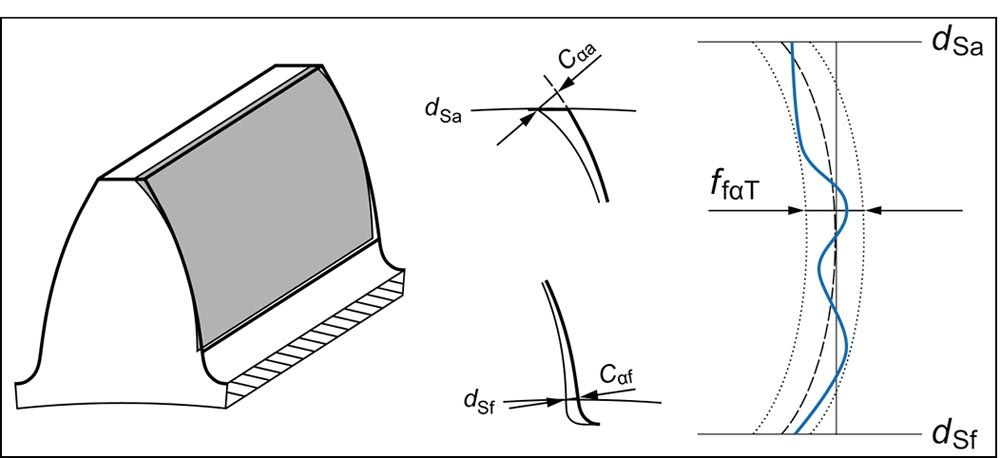
Figure 3—Determination of a profile form deviation ffα.
For example, a profile form deviation is defined in such a way that the required profile form, shown as a dashed line in Figure 3, is moved as far to the right and left (shown as pointed lines) as is necessary to touch the measured profile form, shown as a thick blue line. The distance by which the profile form is displaced to the left and right then accounts for the profile form error ffα according to ISO 1328. It is obvious that there are different profile forms that all have the same value for ffα. This methodology can only partially evaluate the influence that a specific deviation of this kind has on a gear’s noise characteristics. The same applies for the flank line form deviation (Ref. 3).
Example: Natural twist resulting from flank line crowning
A classic example, how the manufacturing process can influence the tooth properties, is the production of flank line crowning on a simpler grinding machine. During the generation grinding process of a helical gear tooth, the movement of the tool results in a specific deviation error called “natural twist.” This deviation consists of a twist with a small overlaid profile crowning (Figure 4). Modern grinding machines can compensate for this twist caused by manufacturing, but simpler machines cannot. Such a twist can greatly influence the contact pattern and the excitation characteristics in the meshing and is normally not desirable.
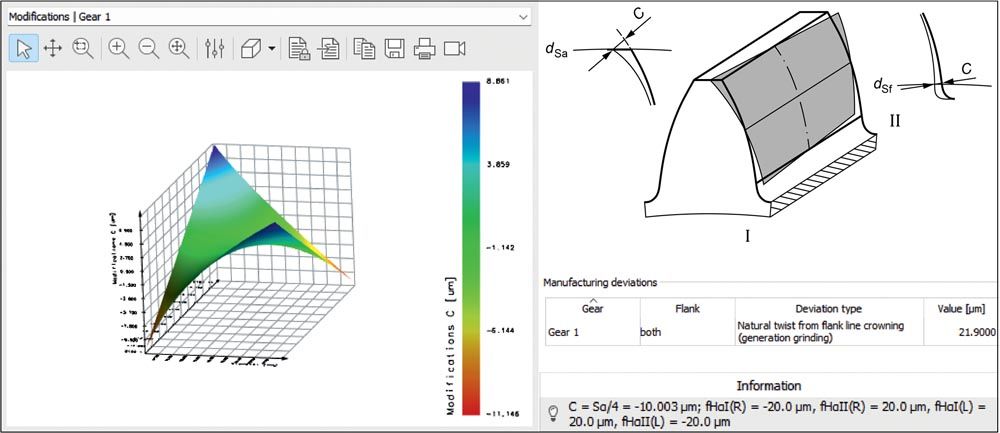
Figure 4—Natural twist caused by manufacturing (Sα 10,004 μm according to ISO 21771) when a flank line crowning (21.9 μm) is produced using generation grinding. Calculation in KISSsoft (Ref. 1).
However, in the case of a helical gear, a flank twist is sometimes deliberately used as a modification, in certain cases. This shows that a twist caused by manufacturing can sometimes be useful. If the design software enables the twist caused by manufacturing to be calculated and taken into account in the contact analysis, the resulting manufacturing deviation can be included at gear sizing stage. This simplifies the grinding process considerably and it is easier to achieve the target contour.
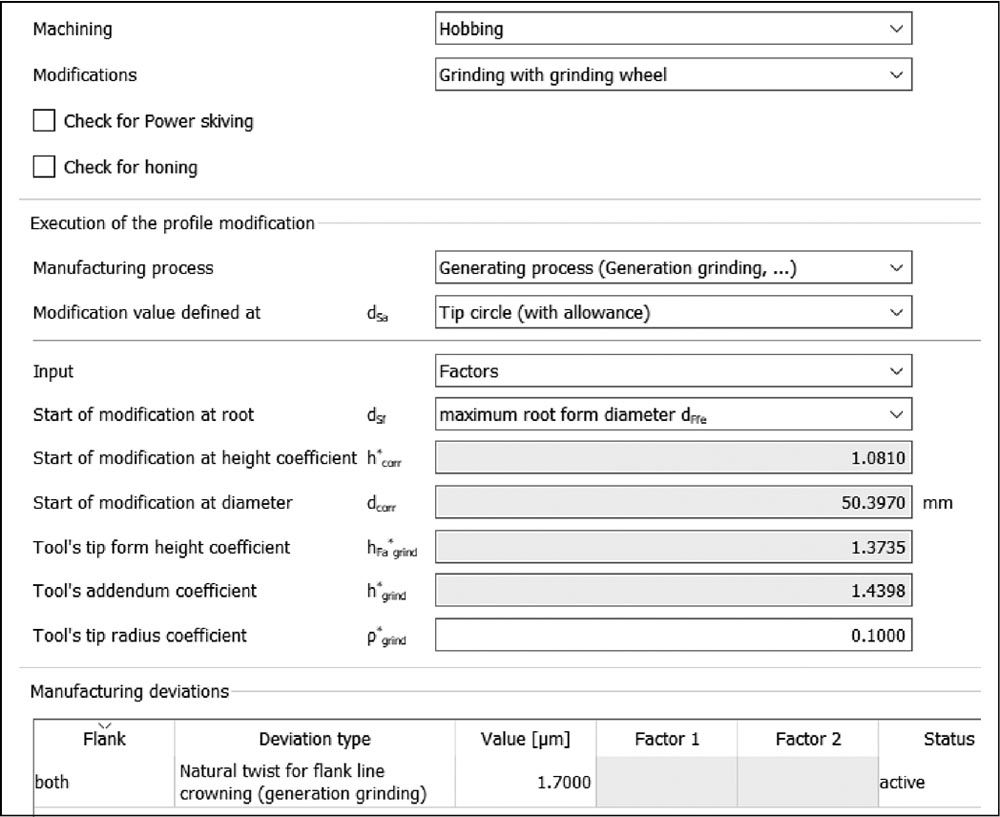
Figure 5—Checking the manufacturability in a special “Manufacturing” tab in KISSsoft.
Integrating Production expertise when sizing gears
As discussed above, it is useful to take a manufacturing method’s properties into account when sizing gear tooth geometry and modifications. The manufacturing method also affects the costs and can therefore be extremely important, especially in the case of larger production series. For example, gear honing is a very cost-effective method for large production series but can only be used up to approximately module 6 mm. Alternatively, power skiving can be a very productive way to manufacture a gear, compared to the use of a shaper cutter, but it is necessary to check whether the workpiece and the tool might collide.
However, it is often the case that the gear designer does not have enough expertise in production to overcome the restrictions inherent in the different processes. For this reason, KISSsoft (Ref. 1) strives to integrate production expertise in its sizing software. The challenge is to be able to check the usability of a particular manufacturing method without the designer is asked for details that he does not know. For example, it should be avoided that the designer being asked to enter the diameter of the shaft of a power skiving tool which he may not know. This makes the development of manufacturing verification programs a challenge.
As KISSsoft AG has now been integrated with Gleason (Ref. 2), there are a number of new options for achieving this task.
The influence of manufacturing quality on NVH performance
The nature of the problem
As previously discussed, the production of predefined modifications, especially topological modifications, can be difficult. Naturally, the designer wants that the modifications as defined, e.g., especially for low-vibration gear sizing for EV applications, to be produced as accurately as possible.
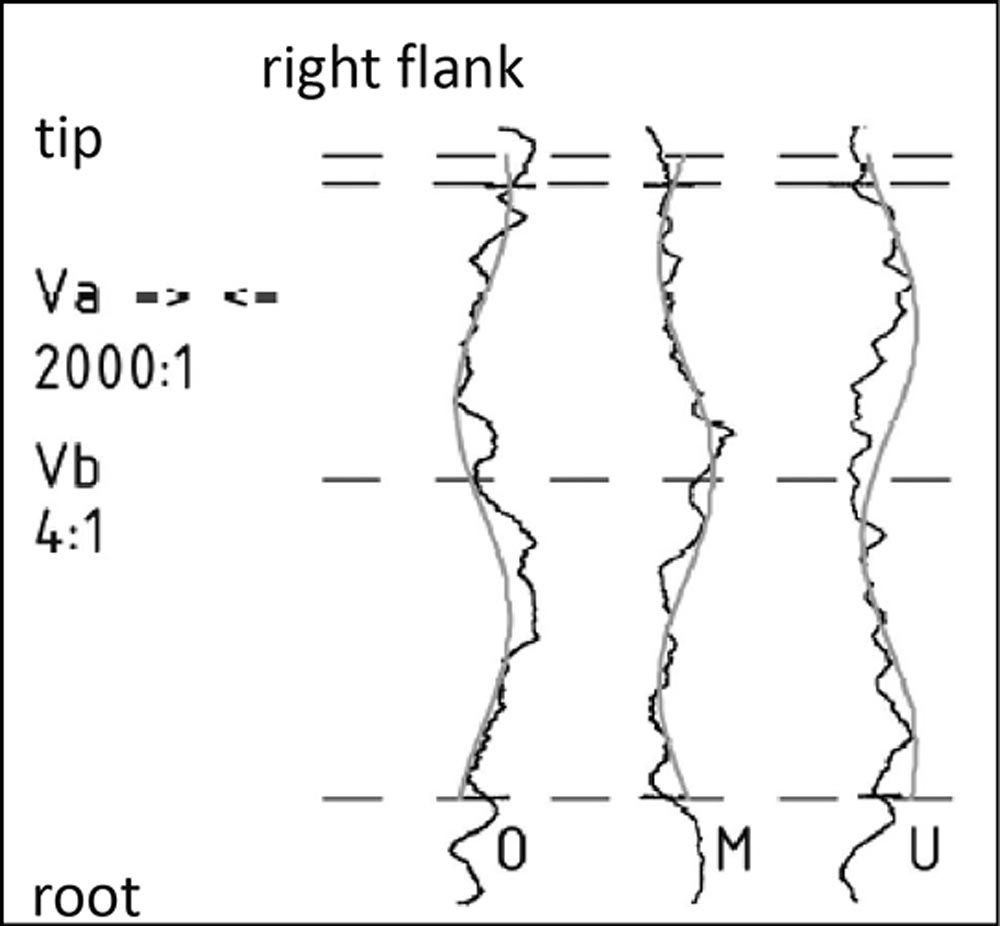 In practice, the profile form deviation, in particular, is often greatly restricted. In some cases, requirements are specified that are almost impossible to manufacture. This increases cycle times and therefore manufacturing costs. This begs the question of whether the required high quality actually produces any real improvements or whether, for example, a well-sized profile modification isn’t more effective than simply reducing the permitted manufacturing allowances.
When the profile and flank lines in gear measurements are analyzed, the signal is always scattered and usually overlaid with a certain basic waviness. Consequently, the amount of waviness directly influences the resulting profile and helix form deviation.
It is logical that a waviness on the tooth flank is, or can be, the cause of vibration (Ref. 4). On the other hand, it has also been confirmed that the excitation is not necessarily proportional to the amplitude or length of the waviness (Ref. 5). A certain amount of waviness can even improve the noise characteristics. This has been investigated in tests at TU Munich’s FZG (Gear Research Center), which have proven that a significant reduction in noise can be achieved with a precisely predefined waviness (Refs. 6 and 7).
This arose the idea of applying an additional waviness to a theoretically optimally sized tooth (with and without modifications) and then testing the influence of such a deviation on the required properties. First of all, a tooth pair in a theoretically error-free state should be investigated with contact analysis (under load), to determine the usual critical properties such as transmission error, excitation force, Hertzian pressure, loss etc. After that, an additional waviness is applied to the tooth so that the calculation can be repeated and the deviation from the results of the first calculation can be determined. The order of magnitude of the waviness should correspond to the form deviation (ffα for the profile or ffβ for the flank line) of the intended accuracy grade (e.g., according to ISO 1328).
Application in the calculation
To enable this calculation to be performed, a table was added to the “Manufacturing” tab in KISSsoft (Ref. 1) (Figure 5), in which the user can enter manufacturing deviations (Figure 6).

Figure 6—Selecting and inputting waviness types in KISSsoft.
The manufacturing form deviation can be simulated as waviness in the profile direction, in the flank line direction, or in the direction normal to the tool which is used to produce the gear, as defined in Table 1. Inputs can also be cumulated by entering deviations multiple times.
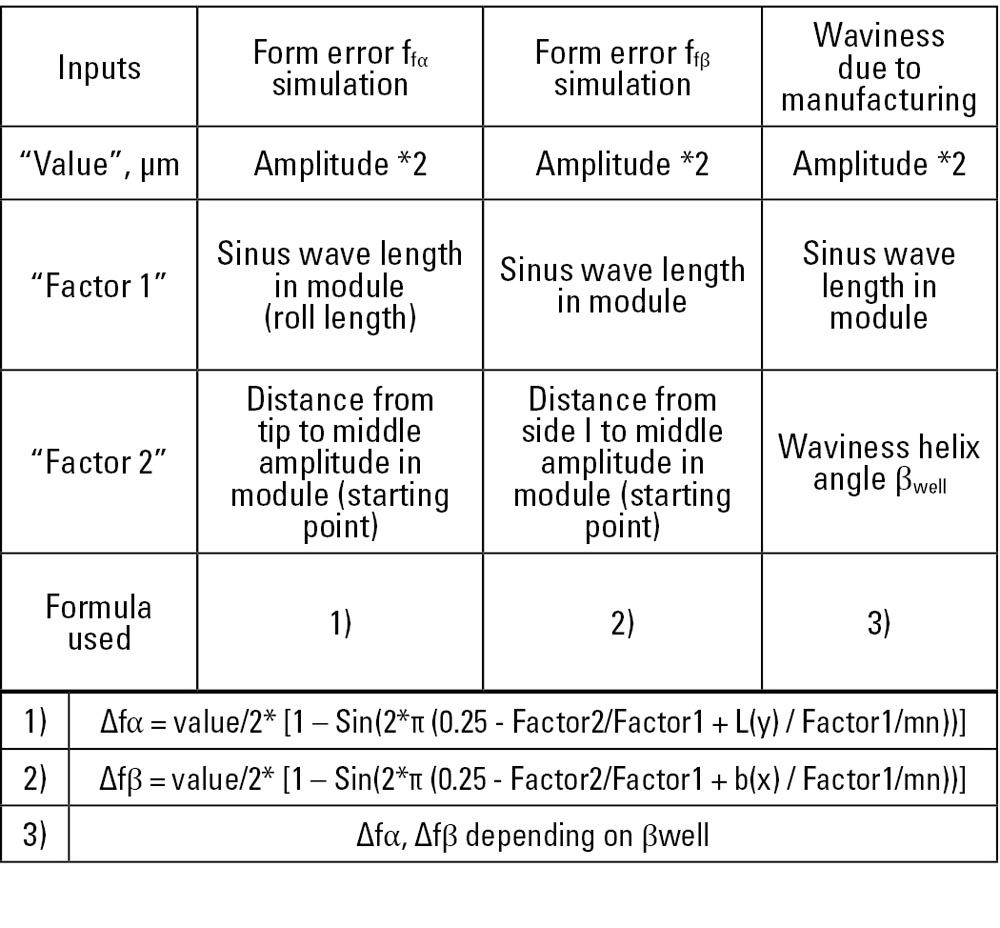
Table 1—Waviness definition
One important problem relating to the determination of the influence of waviness on meshing is that waviness resulting from manufacturing can vary from one tooth to the next, or from one workpiece to the next. The wavelength, wave start (Figure 7), and amplitude will vary randomly. This is obvious in analyses from gear-measuring machines (Ref. 5). So a large number of calculations must be performed to analyze the scatter of these parameters. Different variants of the amplitude, length, and start values are generated. Contact analysis is performed for each variant to calculate the most important results, which are then displayed.
An enormous amount of time would be needed to perform this procedure step by step with manual calculations. The use of the script language integrated into KISSsoft (Ref. 1) is a good solution in this case. The engineer performing the calculations can use a script editor to write and run their own functions in the software. This then enables the contact analysis to be calculated automatically many times, with varied waviness (Figure 8). The results are saved and displayed in an overview.
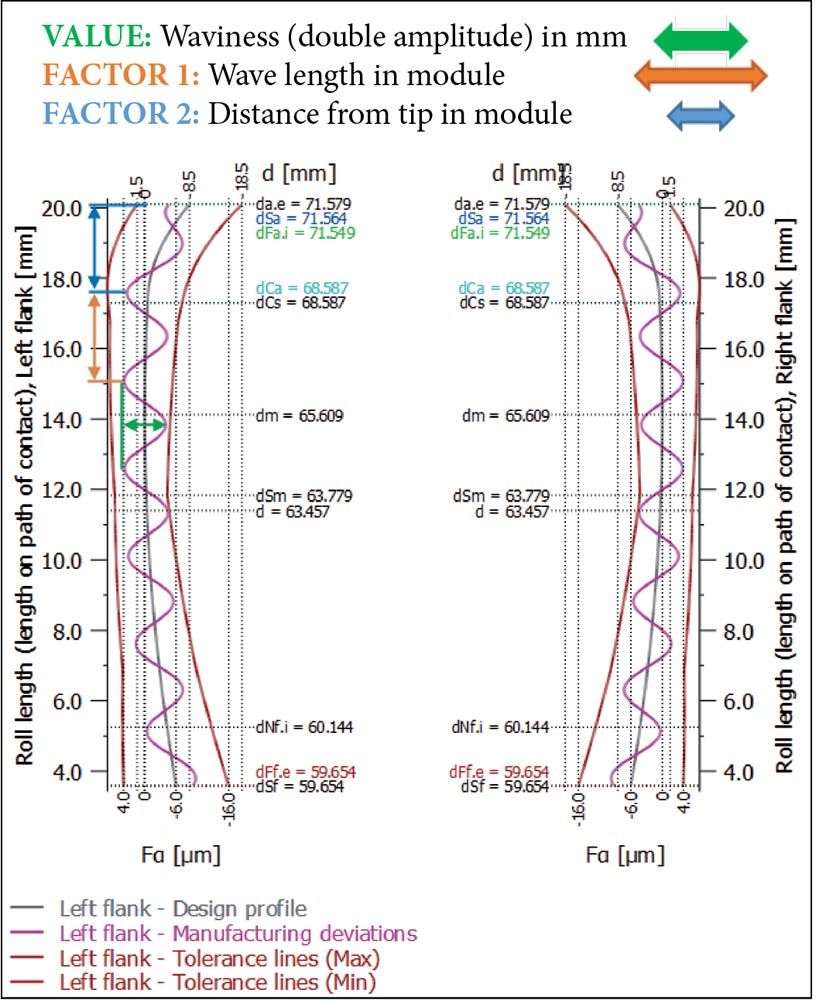
Figure 7—Display of the waviness in the Profile diagram.
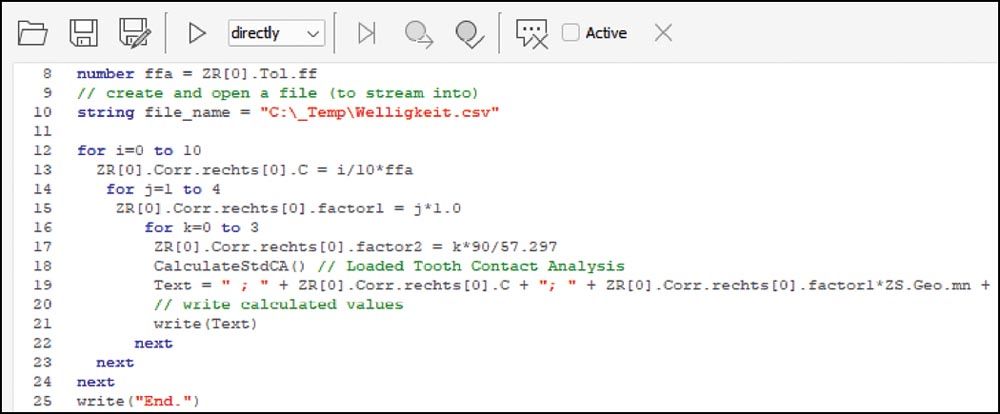
Figure 8—Extract from a script program with which the waviness resulting from manufacturing can be varied (the amplitude is varied in 10 steps, the length in 4 steps, and the start in 4 steps).
Profile form deviations
As an initial example, the method is applied to an industrial gear unit without modifications. The considered output stage has a module of 6 mm, number of teeth is 26:75, face width is 26 mm and the output torque is 5,000 Nm. The specified quality for the case-hardened gears according to ISO 1328 is Q6. The permitted profile form deviation ffα (Figure 9) equals 12 μm.

Figure 9—Profile deviations according to ISO 1328-1 (Ref. 8).
The peak-to-peak transmission error (PPTE) is calculated with different waviness types resulting from manufacturing. The double amplitude (peak to valley value) is varied from 0 to 12 μm. A double amplitude of 2*6 μm corresponds to the maximum permitted profile form deviation (12 μm) if the quality is Q6. If the specified quality is 3, 4 or 5, the double amplitude would be 2.1, 3.0, or 4.3 μm. Figure 10 shows the result if the double amplitude is varied from 0 to 12 mm, the wavelength is varied from 3 to 9 mm and the length of the start from the tip is varied with 0, 25, 50, and 75 percent of the wavelength. The graphic contains all the PPTE results with the same amplitude on the same x-coordinates. This shows the bandwidth of the results depending on the length and starting angle. For a given amplitude, the PPTE will consequently lie within the interval shown.
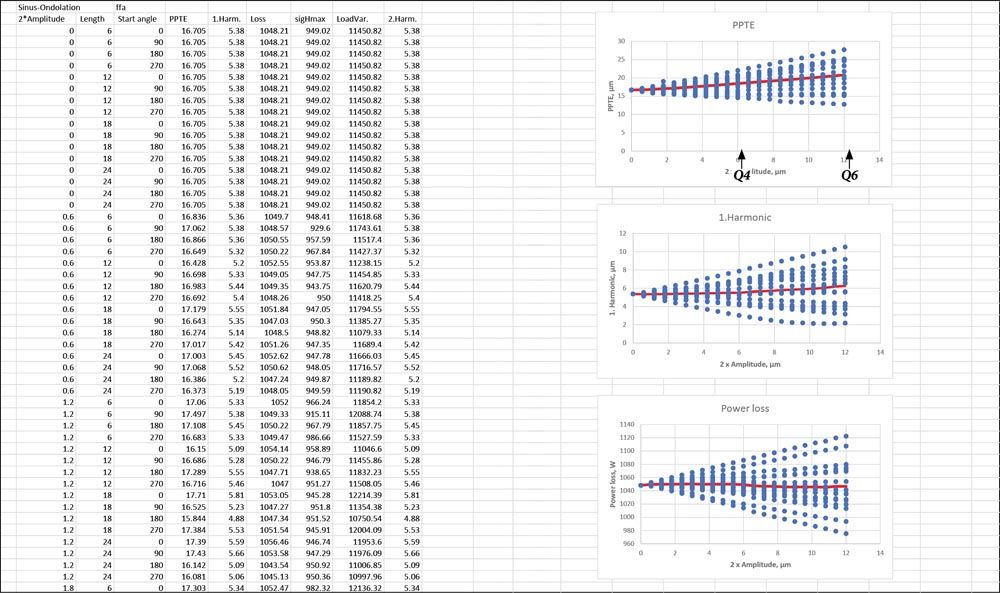
Figure 10—Influence of the waviness (on the profile) resulting from manufacturing on the transmission error (PPTE) in the case of a gear pair with module 6 mm. (Red line: mean value.)
The PPTE for the error-free gear is 16.7 μm. If the tolerance is Q4, the PPTE increases on average by around 11 percent and lies within a range of 15.2 to 22.0 μm. If the tolerance is Q6, the PPTE increases on average by 21 percent, within the range 12.8 to 27.7 μm. When we consider that the PPTE can be reduced by 50 percent or more by using an adjusted profile modification, an increase of 21 percent is absolutely within the bounds of what is acceptable. Consequently, specifying Q6 for this gear set is appropriate as the manufacturing costs for Q6 are considerably lower than for Q4.
The increase is not relevant for power loss as the average reduction is 1 percent. By contrast, the effect on Hertzian pressure is bigger. In the case of Q6, the maximum Hertzian pressure increases on average by 11 percent (Figure 11).

Figure 11—Influence of the waviness (on the profile) resulting from manufacturing on the power loss (top) and the maximum Hertzian pressure (bottom).
Flank line form deviations
The specified helix form deviation for the gear under consideration, ffβ, equals 11 μm for Q6, in the case of face width 44 mm. Figure 12 shows the result if a waviness is applied in the flank line direction, the amplitudes are varied from 0 to 11 mm, the lengths are varied from 7.5 to 22 mm and the starting angle is varied with 0, 25, 50 and 75 percent of the wavelength.
The influence of a flank line waviness on the transmission error is extremely low (in the case of Q6, the PPTE increases on average by around 0.2 percent)! The power loss increase is also minimal (
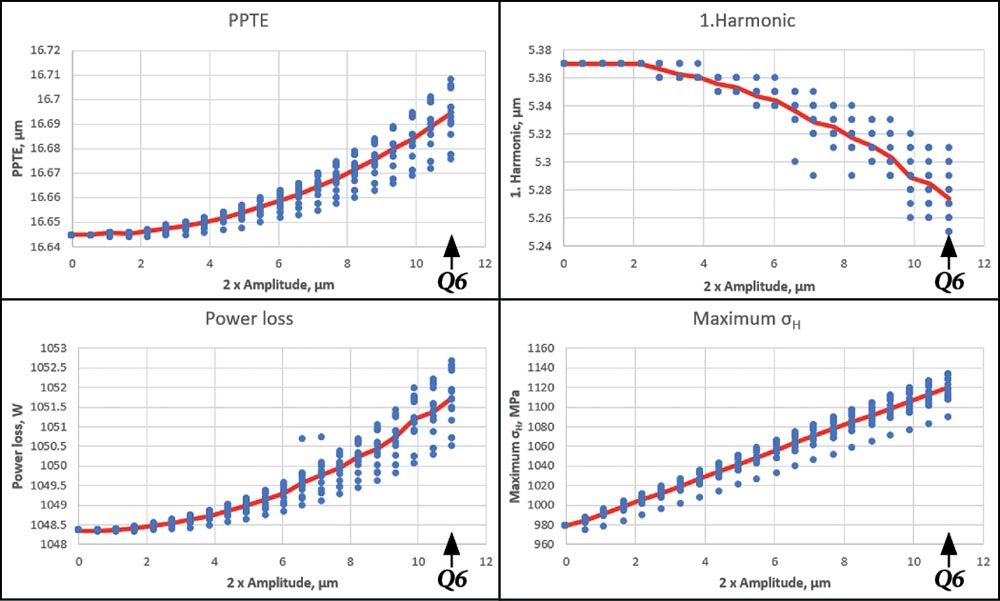
Figure 12—Top: Influence of the waviness resulting from manufacturing (flank) on the transmission error (PPTE) and the amplitude of the first harmonic (FFT analysis) in the case of a gear pair with module 6 mm. Bottom: Influence on the power loss (left) and the maximum Hertzian pressure (right).
Waviness normal to the direction of processing
Waviness in the direction normal to the tool which is used to produce the gear can, for example, occur through the milling process. The waviness influence on the transmission error (PPTE) is similar to the waviness influence in the profile direction. In the case of Q6, a maximum increase of 25 percent results. The maximum Hertzian pressure changes in the range +10 percent to +100 percent (Figure 13).
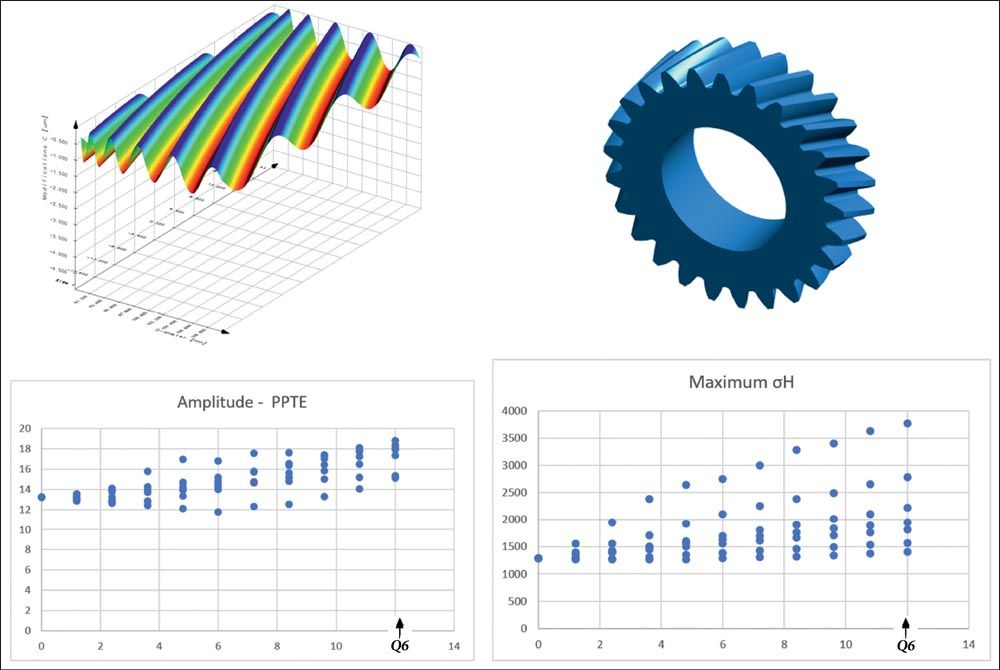
Figure 13—Influence of the waviness resulting from manufacturing in the direction of processing (top left) on the transmission error (PPTE, bottom left) and the maximum Hertzian pressure (bottom right).
Application in the case of EV gear units
Gear units for industrial applications usually either have no modifications, or only more simple modifications. In contrast, complex modifications are always used in vehicle gear units in general and EV gear units in particular to optimize load distribution, noise characteristics and loss/efficiency. Gear pairs of this kind usually have much less transmission error than a conventional gear unit. Investigating the effects of manufacturing errors on gears with significant modifications is necessary for that reason, and can produce entirely different results.
The example described is the interim stage in an EV gear unit from a car made by a well-known manufacturer. The gear pair module is 1.57 mm, the number of teeth is 33:87, the face width 35 mm, the helix angle 23.5° and the drive torque 500 Nm. The specified quality for the case-hardened gears according to ISO 1328 is Q5. The permitted profile form deviation ffα equals 6 μm. The flank modifications are shown in Figure 14.

Figure 14—Profile and flank line modification of the investigated EV gear unit.
The transmission error (PPTE) of the error-free gear equals 0.71 μm. Without modifications it would be 1.7 μm. This shows the importance of the modifications. In this example, the evaluation (Figure 15) shows that a waviness has very little influence on the mean value of the PPTE (an increase of 10 percent in the case of quality Q5). However, the PPTE scatter—depending on the wavelength or the position of the first amplitude—becomes more significant in the case of greater amplitudes than in the case of the example in “Application for an industrial gear unit.” In the case of a tolerance of 6 μm (quality Q5), the PPTE can change by +50 percent (in the worst case) or -28 percent (in the best case). This is not unexpected: Teeth with significant modifications are often less tolerant when it comes to manufacturing deviations. Naturally, however, the method described here can also be used to define modifications which are as “tolerant” as possible concerning manufacturing deviations!
The influence of the manufacturing deviations on the efficiency (loss) is very low (Figure 16). The loss in the case of Q5 (double amplitude 6.0 μm) only changes in the range ±6 percent, compared with the value for the theoretical tooth. However, in accordance with expectations, the influence of the manufacturing allowances is much greater in the case of the Hertzian pressure. In the case of Q5, the maximum pressure increases on average by 38 percent, ranging from -9 percent to +67 percent (Figure 16).
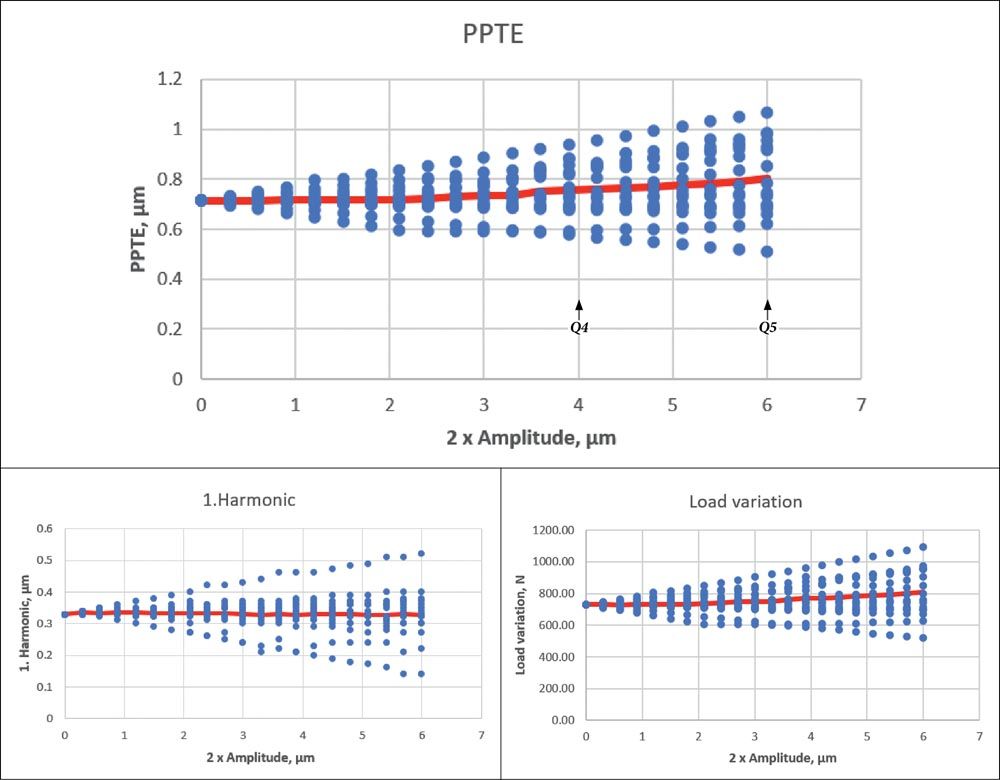
Figure 15—Influence of the waviness (profile) on the transmission error (top), the amplitude of the first harmonic (bottom left) and the excitation force in the case of an EV gear pair (bottom right). (Red line: mean value.)

Figure 16—Influence of waviness (profile) on the power loss (left) and the maximum Hertzian pressure (right).
Inclusion of slope deviations, simulation of total deviations
So far, the influence of form deviations on the profile (ffα) and form deviations on the flank line (ffβ) caused by waviness has been discussed. However, tooth flank manufacturing allowances consist of form and slope deviations (fHα, fHβ) which are combined to produce the total deviation (Fα, Fβ) result (Figure 9). So, different variants of the slope deviation have to be cross correlated with form deviations. This does increase the time needed for calculation, but generalizes the method.
Note:
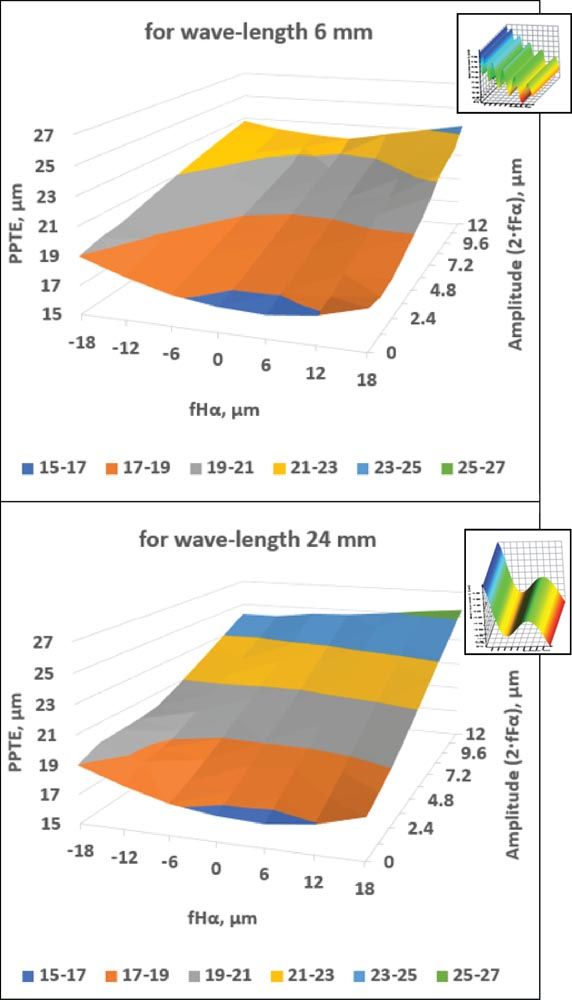
Figure 17—Influence of profile slope deviations fHα combined with profile form deviations ffα on the transmission error (PPTE). Top: short wavelength 6 mm. Bottom: long wave length 24 mm. The manufacturing deviations on the flank with maximum values for ffα and fHα are shown on the left side.
In this example, the profile slope tolerance for Q6 equals ±9.5 μm and the form tolerance is 12.0 μm (amplitude 6.0 μm). The range shown in Figure 17 shows the progression from Q4 to Q6. The analysis shows that the slope deviation has less influence on the transmission error than the form deviation. Figure 18 shows the same results in a different way. The tolerance range permitted up to Q6 is displayed here. The lesser influence of the slope deviation is clearly visible, both in the case of PPTE and the maximum pressure.
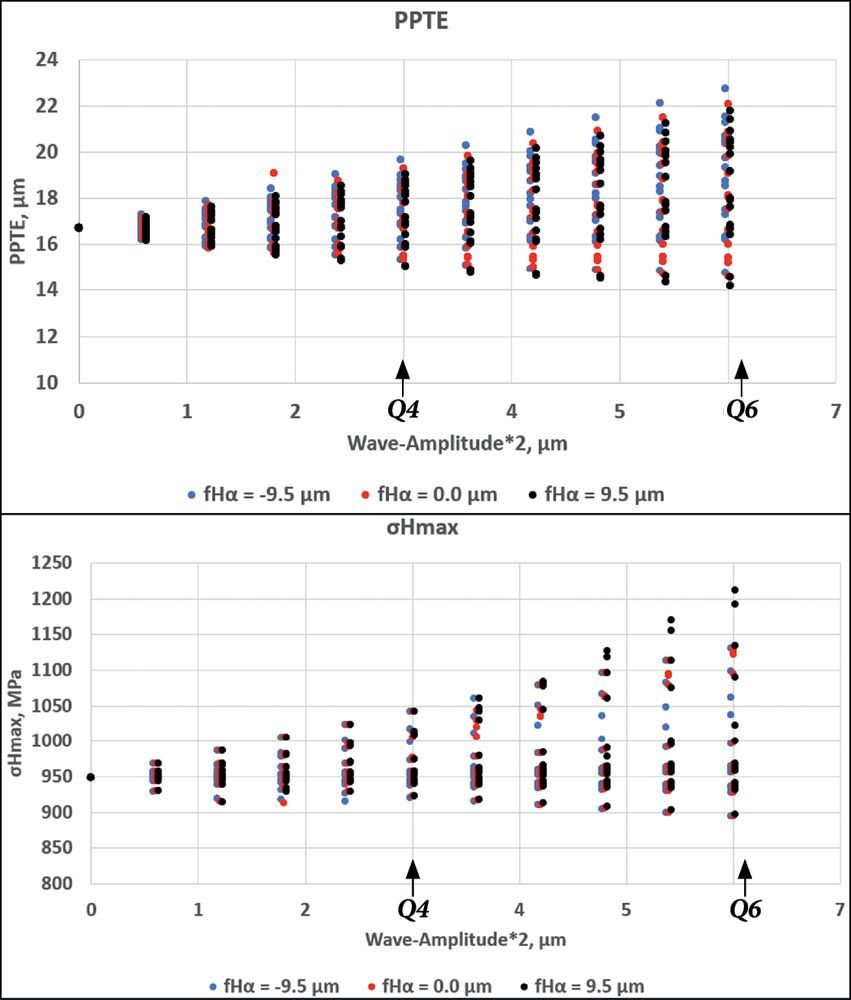
Figure 18—Alternative representation of the results. The profile slope deviations fHα are only varied using 3 variants (-9.5, 0 and +9.5 μm) and are highlighted in color. Top: representation of the transmission error (PPTE) as in Figure 17. Bottom: maximal Hertzian pressure.
Summary
Well-sized modifications on the tooth will enable the service life to increase, will reduce the causes of vibration and reduce noise levels. The modifications must be manufactured as exactly as possible, to achieve the required properties over the speed-torque range of the gearbox. In practice, therefore, the form deviation in particular is greatly restricted. In some cases, requirements are specified that are almost impossible to manufacture. This increases cycle times and therefore manufacturing costs.
To evaluate the influence of the manufacturing deviations, a sinus-shaped waviness is applied to the theoretical ideal tooth flank. The waviness can be modified with amplitude, length and initial value parameters. Such a manufacturing deviation can be applied in both the profile or flank line direction, or in the direction of manufacturing tool, or a combination of the above. By systematically varying these parameters, it is possible to investigate the extent to which the required gear properties, such as transmission error, excitation force, efficiency or maximum Hertzian pressure, change.
For example, if the double amplitude of the waviness on the profile approximately matches the profile form deviation tolerance (ffα) according ISO 1328 for a specified quality X, it is possible to determine how “stable” the gear is with regard to manufacturing errors. The quality requirement can then be increased appropriately, to X-1, or reduced appropriately, to X+1, which will in turn also change the manufacturing cost.
Besides form deviations, also slope deviations and total deviations can be investigated. Slope deviations in the range of the specified quality tend to have a lesser influence on the gear properties.
Two examples from practice are discussed: An application involving an industrial gear unit and one from an EV gearbox (electric vehicle). The analysis shows that gears with well-sized modifications that already have a low PPTE value are more sensitive to manufacturing deviations. The discussed examples show clearly that, in this particular case, there is no point in specifying an accuracy that is higher than Q4. The changes to the meshing’s properties are then so minimal that the extra effort involved cannot be justified.
Manufacturing deviations in the profile direction only have a minimal effect on the power loss. However, the transmission error (PPTE) and maximum Hertzian pressure are clearly dependent on deviations. As investigations at the FZG in Munich have proven, the transmission error can even improve in the case of certain waviness. Flank line form deviations caused by waviness are much less critical than profile form deviations. When the investigation was extended to include form deviations in combination with slope deviations—i.e., to simulate total deviations—it showed that slope deviations have less influence on the gear performance.
The methodology can also be used to test different modification variants, and to evaluate how tolerant a certain gear design is regarding manufacturing deviations.
References
- KISSsoft & KISSdesign: www.kisssoft.ag
- Gleason Corporation: www.gleason.com
- Müller, H.: Fertigungssimulation als Basis für Industrie 4.0, Schweizer Maschinenelemente Kolloquium, 2018.
- Sundar, S.; Singh, R.; Jayasankaran, K.; Ohio State University: Effect of the Tooth Surface Waviness on the Dynamics and Structure-Borne Noise of a Spur Gear Pair. SAE International Journal of Passenger Cars. 2013.
- Malburg, M.; Zecchino, M.: Understanding and Controlling the Source of Gear Noise. Gear Technology, August 2021.
- Heider, M.K.: Schwingungsverhalten von Zahnradgetrieben. Dissertation, Technical University of Munich. 2012.
- Radev, S.: Einfluss von Flankenkorrekturen auf das Anregungsverhalten gerad- und schrägverzahnter Stirnradpaarungen. Dissertation, Technical University of Munich. 2006.
- ISO 1328-1: Cylindrical gears – ISO system of flank tolerance classification—Part 1, 2013. (Identical to ISO DIN 1328-1.)
This paper first appeared: Dresdner Maschinenelemente Kolloquium DMK 2022, April 26–27, 2022.




 In practice, the profile form deviation, in particular, is often greatly restricted. In some cases, requirements are specified that are almost impossible to manufacture. This increases cycle times and therefore manufacturing costs. This begs the question of whether the required high quality actually produces any real improvements or whether, for example, a well-sized profile modification isn’t more effective than simply reducing the permitted manufacturing allowances.


