Generation of the matrix with the frequency of high to low torque
If torque and/or speed have alternating signs so that the loaded flank is changing, for the assessment of the Hertzian pressure on the considered tooth flank (left or right) only the positive values on this flank are considered. For the bending stress this simple calculation procedure cannot be applied. The considered tooth root side is subjected to an alternating load, getting tensile stress with positive torque and compression stress by negative torque. And all significant alternating load cases must be extracted from the torque curve. For that, the so-called rainflow method is used (Refs. 5, 6, 8). Rainflow analysis provides a matrix that shows how often the torque changes from Thigh to Tlow. The matrix, therefore, has two torque bin series, in Y-axis for Thigh and in X-axis for Tlow (Figure 5).
The rainflow method is usually carried out with stresses, not with torques. Because tooth root bending stress and torque are proportional, torque can also be used. In addition, the negative torques are multiplied by 1.2 since the compressive stress on the non-loaded flank is approximately 20% higher than the tensile stress on the loaded flank. Factor 1.2 is used in ISO 6336-3 and can be confirmed with FEM calculations (Fig. 4). A further challenge to get correct results: The torque must be multiplied by the dynamic factor KV and the face load factor KFβ. The rainflow method does not conserve the speed information of a time series. As KV depends on the speed, which is no longer considered in the subsequent rainflow calculation, for every data point of the time series KV is determined and multiplied to the torque. Also, KFβ must be multiplied to the torque of every point because KFβ is not proportional to the torque and will therefore be different for Thigh and Tlow.
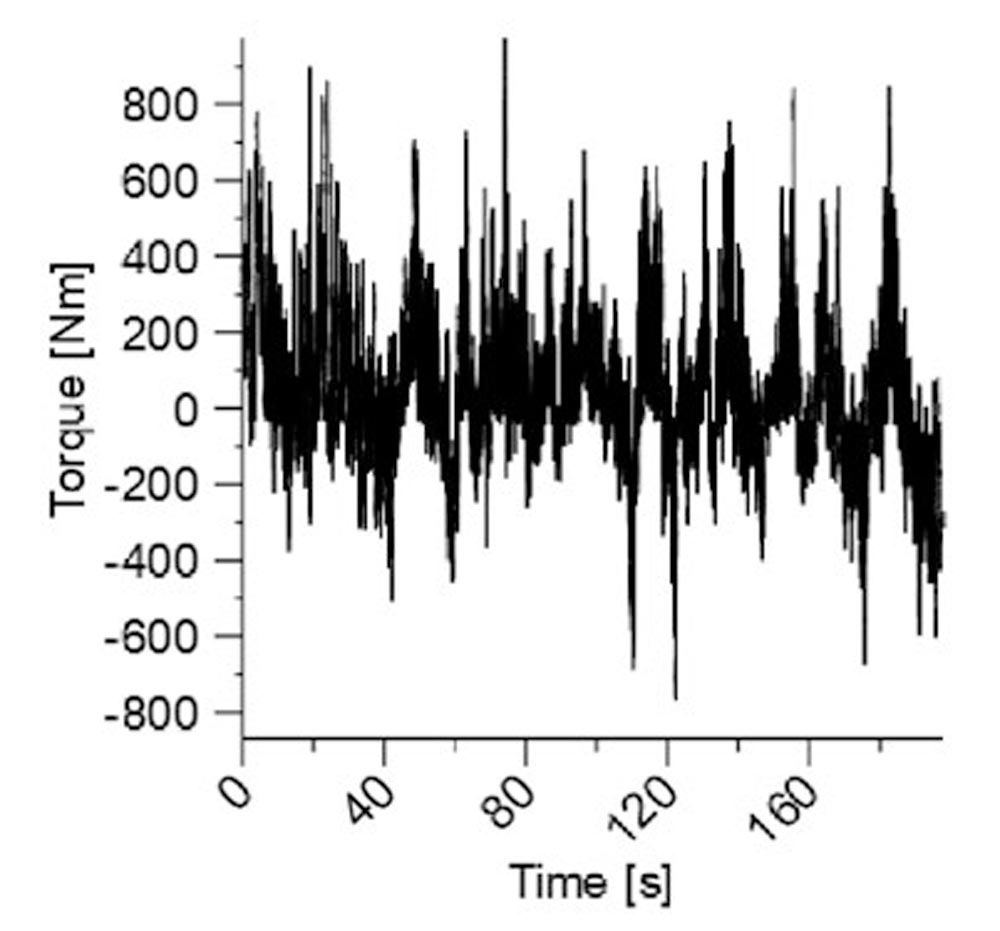
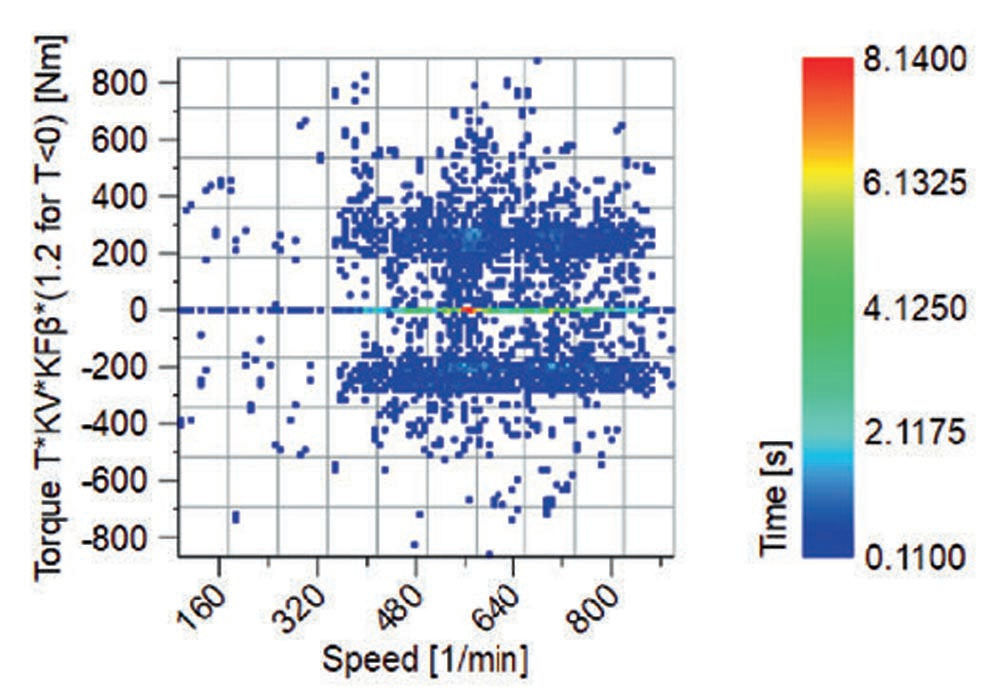
Figure 2—Torque measurement on a test run of a military car (top). Speed/Torque frequency result by simple count (bottom).
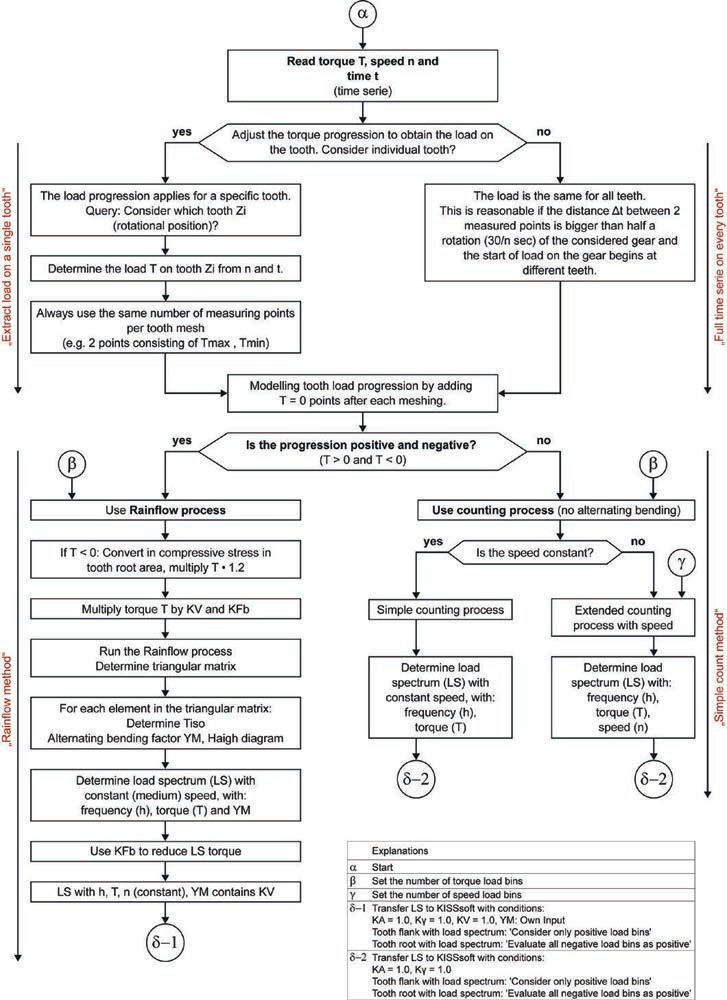
Figure 3—Flowchart to generate a load spectrum for gears from time series data.
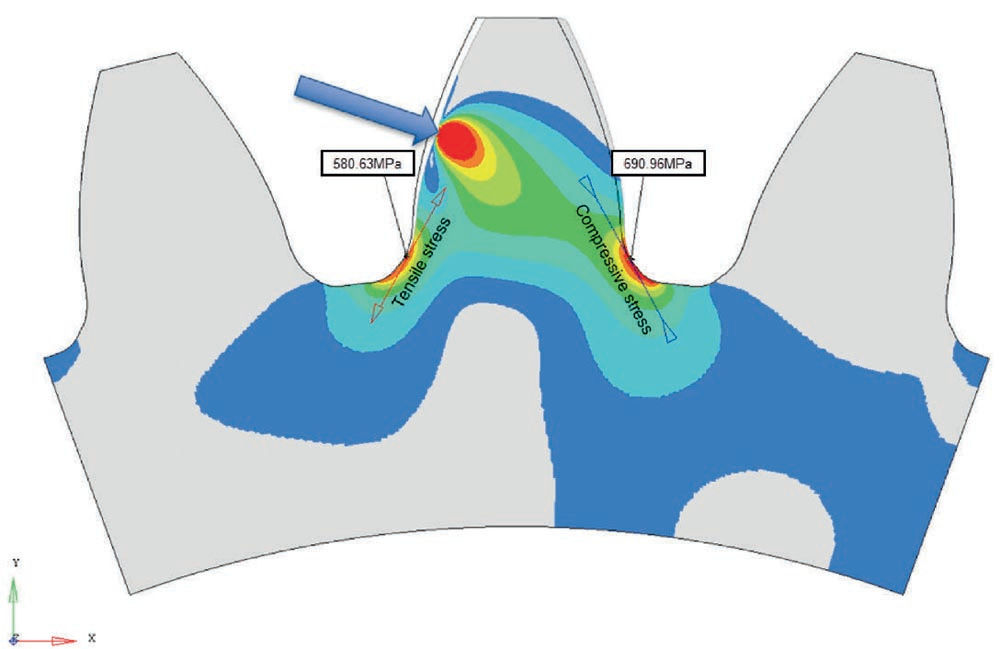
Figure 4—Stresses on the loaded and non-loaded side of a tooth by FEM analysis.
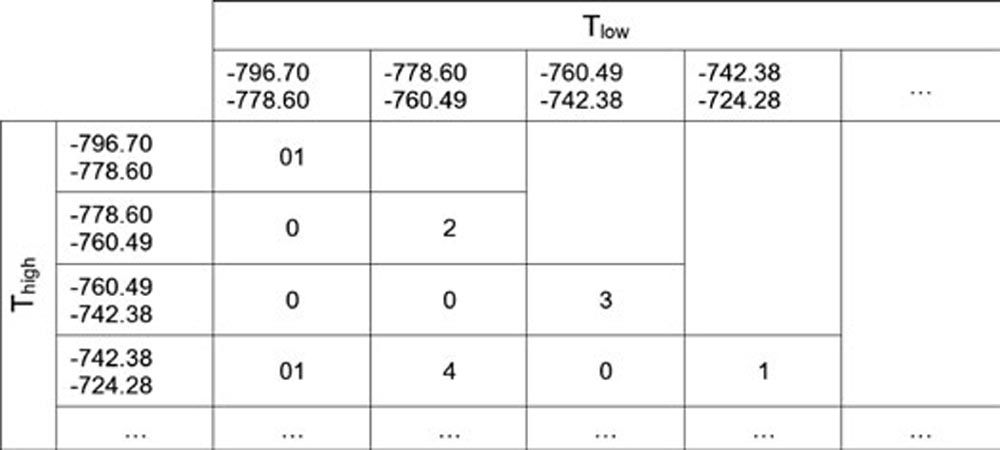
Figure 5—Extract of a rainflow half-matrix with 100 bins.
Conversion of rainflow Thigh and Tlow result to TISO and YM for ISO or AGMA ratings
AGMA and ISO are designed for pulsating load on the tooth; so, the nominal torque and the allowable bending stress numbers are intended for the pulsating load case. For alternate bending (reverse loading) AGMA just mentions that the allowable stress number must be multiplied by a factor 0.7. This factor coincides with older versions of ISO. In the current edition of ISO 6336-3, annex B (Ref. 2), a more precise rule is given for the alternating bending factor YM.
The equation for YM is:
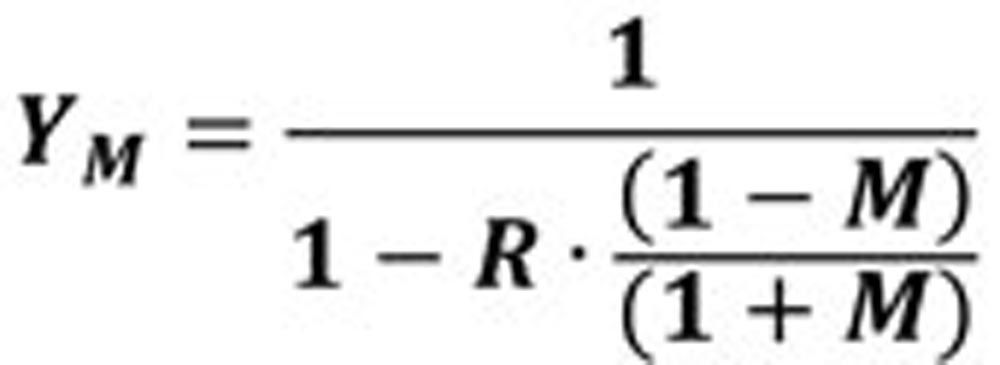
(1)
Where:
R stress ratio. R = - σlow / σhigh; and as here σ is proportional to T, R = - Tlow / Thigh
M considers the mean stress influence on the endurance strength amplitudes; the values are listed in Table 1.
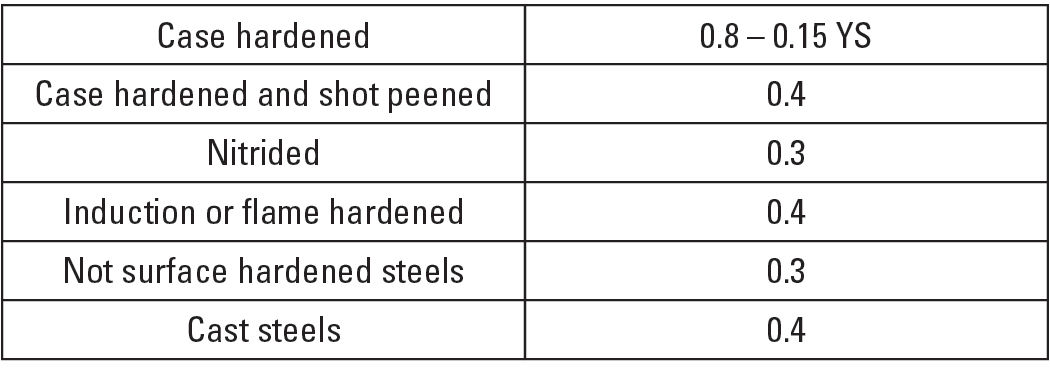
Table 1—Mean stress ratio M according ISO 6336-3, Table B.1 (Ref. 2).
Equation 1 according to ISO may be used within a stress ratio 1 ≥ R ≥ 0. Therefore Equation 1 is only valid if the following conditions apply: Thigh > 0; Tlow low ≤ Thigh. As the general case R may be in the range from -∞ … to +1, Equation 1 must be extended. For the definition of the allowable stress in mechanics the Haigh diagram is appropriate (Figure 6). The construction of the Haigh diagram requires the tensile strength Rm, the yield strength Rp02, the tooth root fatigue strength for pulsating loads (sat according to AGMA, or σFlim according to ISO 6336) and the mean stress ratio M.
Basically, the alternating bending factor YM is a factor that considers the change in the admitted amplitude σadmAmp and the occurring amplitude σLoadAmp of the general case “Gen” compared to the pulsating load case “Puls.”

(2)
The permissible amplitude σadmAmpGen results from the intersection of the RGen line with the Haigh diagram. With the high stress σhigh, the amplitude σLoadAmpGen results in the general case from:

(3)
For the pulsating case “Puls” with RPuls = 0 the following applies:

(4)
Whereas the admitted stress for pulsating bending is:


(5)
Finally, when Equations 3, 4 and 5 are inserted in Equation 2; then rearranged, we get YM for the general case:

(6)
Where:
sat Allowable bending stress number (bending) in AGMA 2101 (Ref. 3)
σadmAmpGen The permissible amplitude from Haigh diagram
It must be noted, that with this general definition of YM all load cases on the tooth root can be considered; also pulsating compressive stress. In such cases, YM will be bigger than one, because the admitted amplitudes in the compressive domain of the Haigh diagram are bigger than the amplitudes in the tension domain.
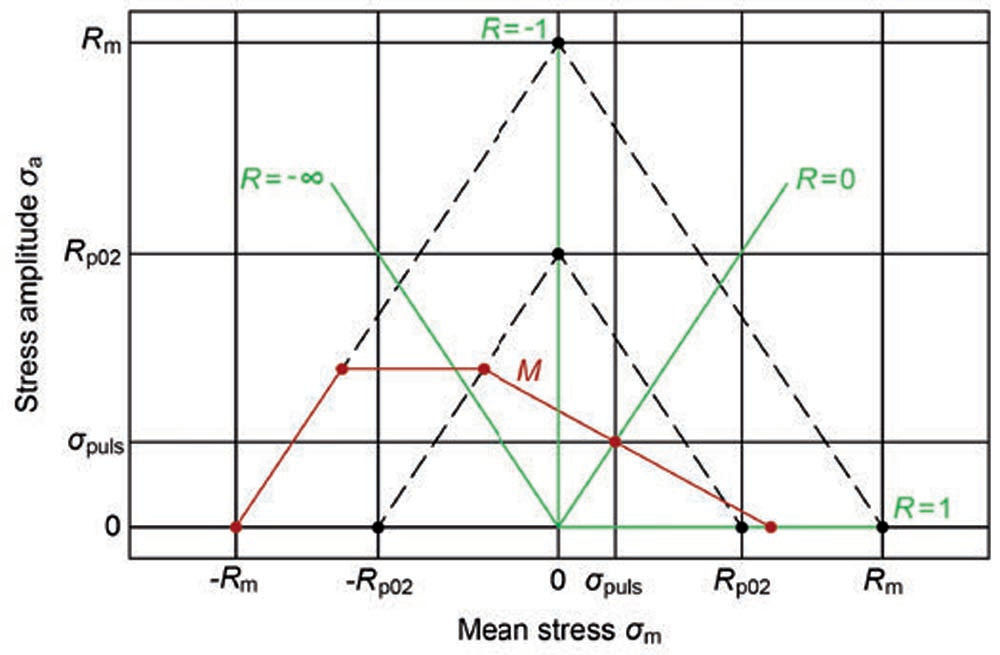
Figure 6—Haigh diagram with mean stress influence M according ISO 6336-3. (Note: The red line “M” is defined by the point {σadmAmpPuls, σadmAmpPuls} and gradient M.)
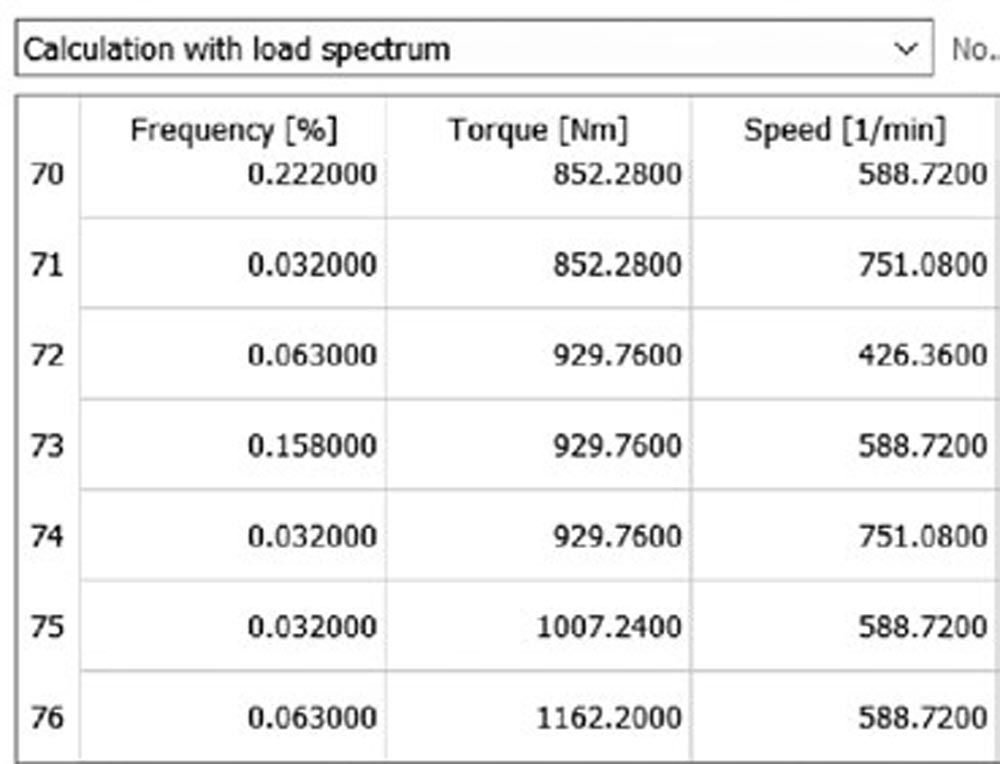
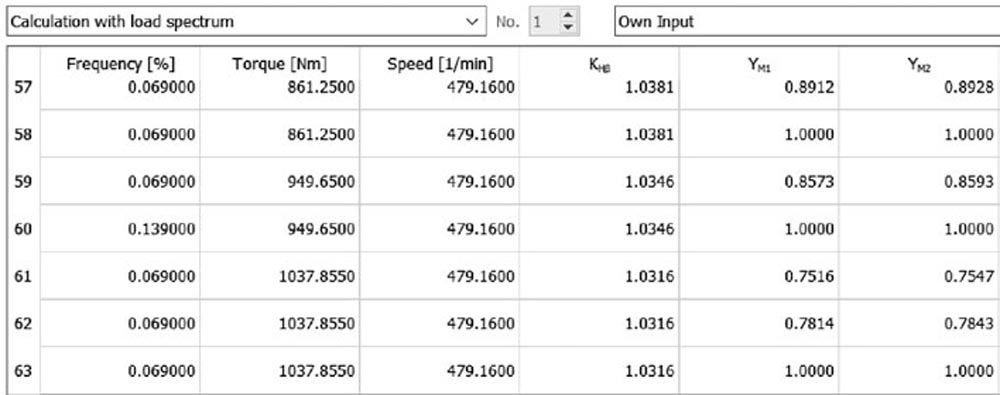
Figure 7—Load spectra examples. Typical simple count method format (top) with frequency, torque, and speed. Typical rainflow method format (bottom) includes alternating bending factors YM.
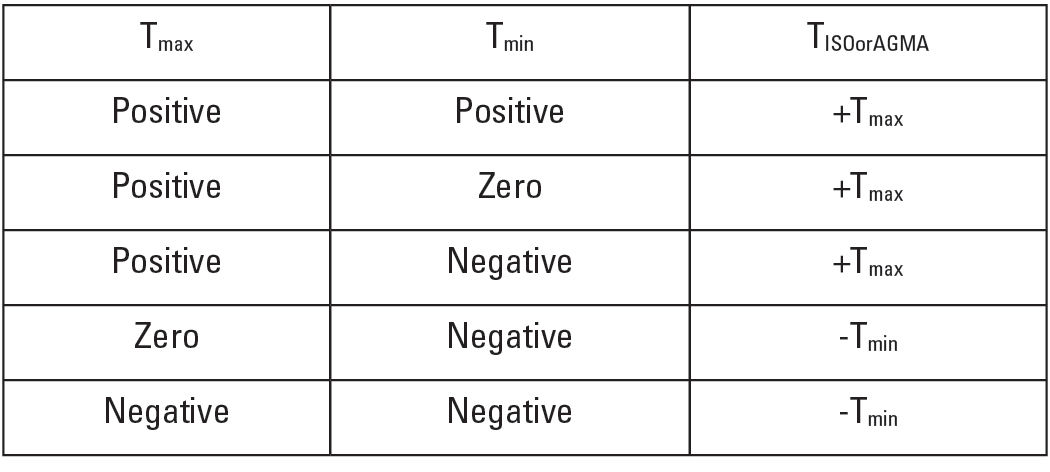
Table 2—Determination of the nominal torque to be used as nominal load in AGMA or ISO.
Generating the load spectra according to ISO 6336-6With the nominal torque from Table 2 and the alternating bending factor YM from Equation 6, every element of the rainflow matrix can now be converted in a bin of the load spectrum. A bin according to ISO 6336-6 (Ref. 1) consists of only two elements, frequency, and torque. The frequency is a percent value of the number of load cycles of the bin versus the total number of cycles. The torque is the TISO or AGMA value according to Table 2. For more general use, this definition must be extended. Generally, it is good practice to add speed as the third element of the bin. This definition of a bin (frequency, torque, and speed) is the most used case for gear and bearing calculations, appropriate to the simple-count method (see “Generation of a load spectrum with the simple count method”). When the rainflow method is used, then for every bin in addition the values YM, one for every gear, must be added (Figure 7).
Application of load spectra in AGMA ratings
A method to calculate load spectra is not explained in AGMA rating methods (such as AGMA 2001, 2101, 2003) but a reference is given to use Miner’s rule as presented in ISO/TR 10495. This norm was replaced in 2006 by ISO 6336-6; the current version is from 2019 (Ref. 1). Gear rating methods according to AGMA and ratings according to ISO have the same basic structure, using general factors and bending and pitting ratings. Both methods use stress cycle factors (as called in AGMA) or life factors (as called in ISO) representing the SN-curves of gear materials. Otherwise, the factors to calculate the stress values and the allowable stresses are sometimes significantly different. The calculation of service life under variable load, as prescribed by ISO 6336-6 (Ref. 1), is using the Palmgren Miner rule, which is a widely used linear damage accumulation method. The method is absolutely “neutral,” which means, that individual factors of the rating method used, are not involved. Therefore, the combination of the ISO 6336-6 method with an AGMA rating is possible and well suitable.
The alternate bending factor YM, as discussed in “Conversion of Rainflow Thigh and Tlow result to TISO and YM for ISO or AGMA ratings,” is only marginally treated in AGMA, only “Use 70 percent of the sat values for … gears where the teeth are completely reverse loaded on every cycle” is mentioned in AGMA 2001, clause 16.2. As this factor in ISO 6336-3 is based on the Haigh diagram, which is a widely accepted concept in material mechanics, it can be assumed, that the factor is also applicable for AGMA ratings.
Gear rating calculation example
A load spectrum can be treated in a gear software package. Usually, a spectrum is introduced manually bin by bin or may be read in from an Excel file. If the spectrum is generated from a time series some additional inputs are needed (Figure 8).
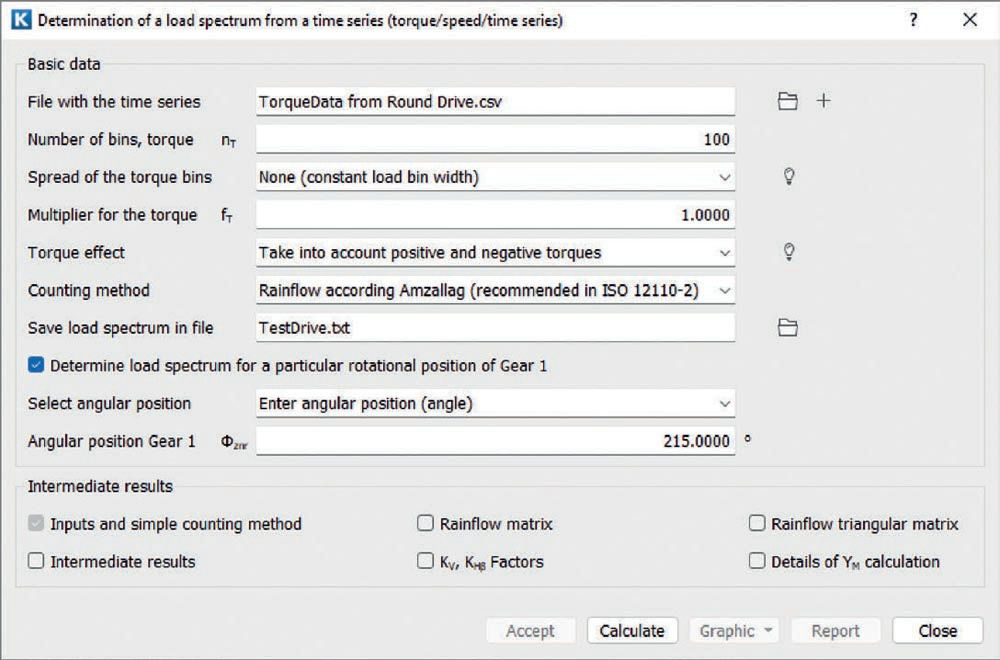
Figure 8—Input window in KISSsoft (Ref. 7) for a duty cycle determination from a time series.
Table 3—Safety, damage, and lifetime, calculated with the time series on different teeth.
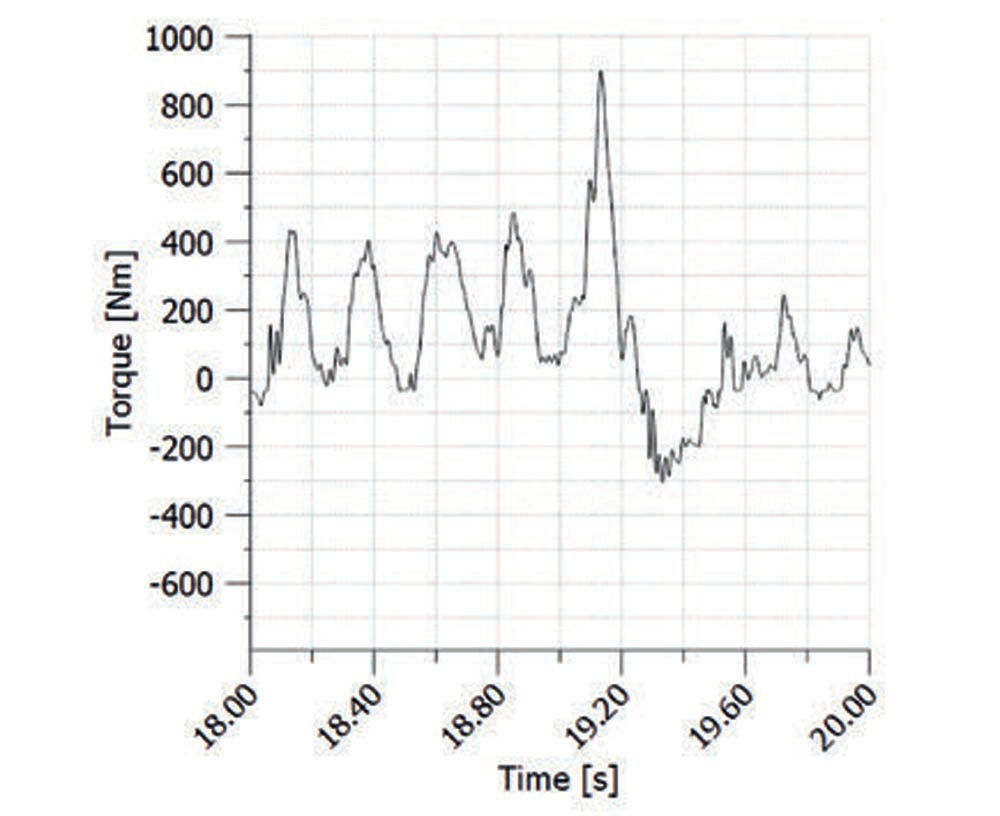
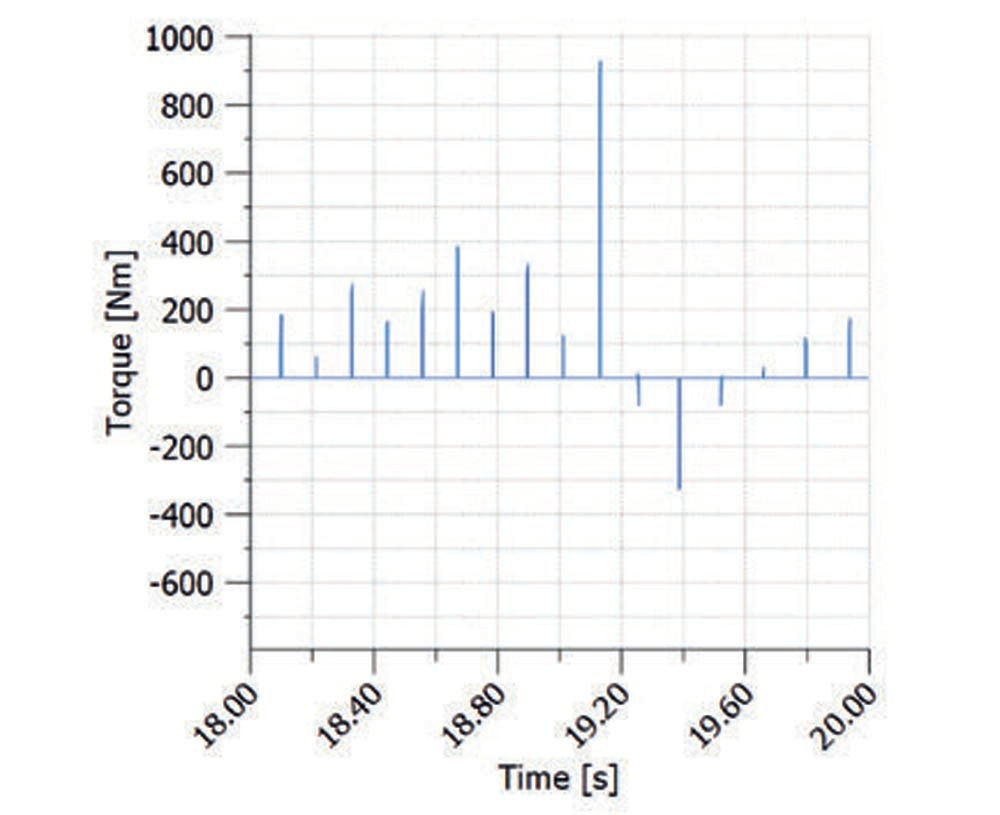
One of the interesting results is the dependency of the considered tooth. As the torque in the time series in Figure 3 is strongly varying, the extract of the load on a particular tooth (Figure 1) gives different safety or lifetime results, see Table 3. But in this example, the duration of the time series is only 190 seconds (short test run). The test run will be repeated several times, the tooth in contact, when starting, will always be different—so the tooth getting the biggest damage will change. Therefore, it is a better practice to consider the results on a tooth having mean damage.
Application of time series in drive train calculations
Today the analysis of drive trains is performed with appropriate software as KISSsys (Ref. 7), which models the complete drive with all the main elements such as gears, shafts, and bearings. Normally the time series is given for the input or the output coupling. A load spectrum can be defined at this position and being used all over the drive system. A problem arises when time series with positive and negative torques are used. Then, because of the different frequency of alternating load changes, for every gear stage, an appropriate load spectrum must be used (Figure 9).
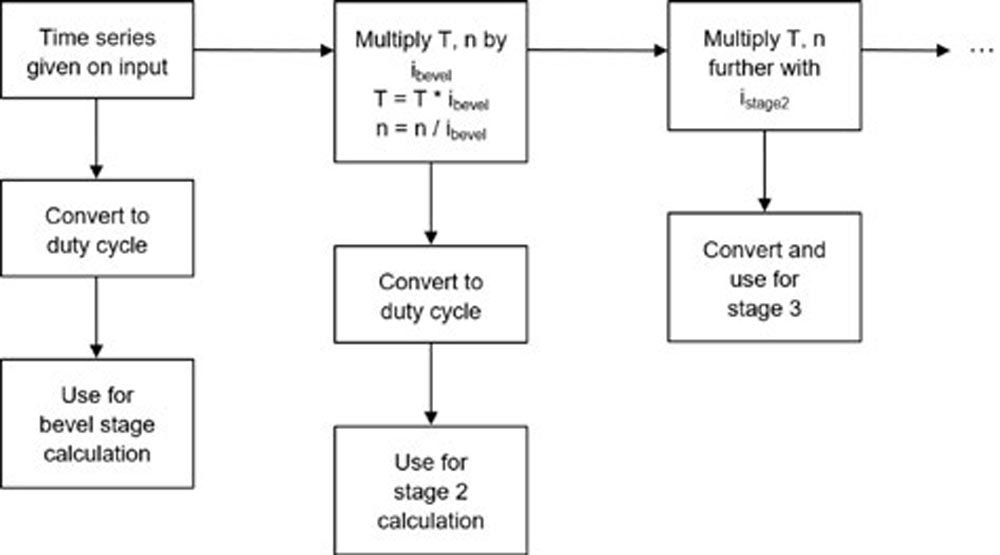
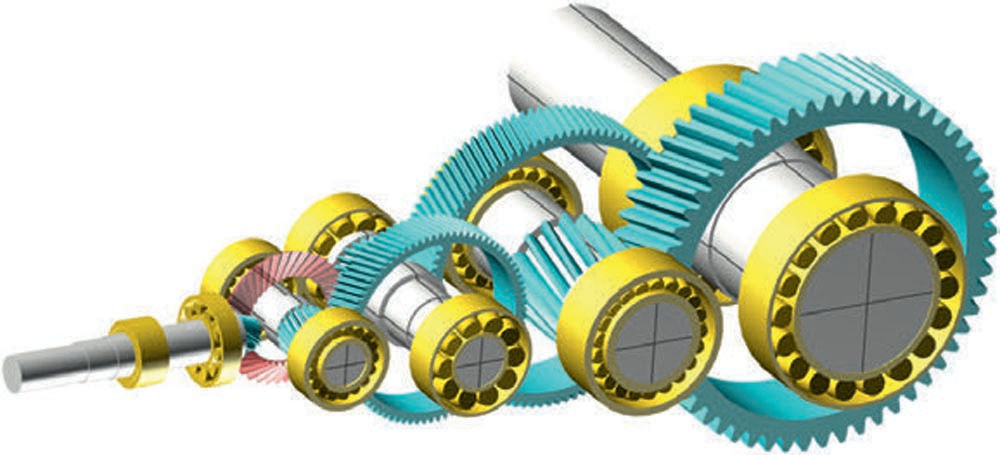
Figure 9—Industrial gearbox in KISSsys (Ref. 7), flow chart for the load spectrum determination.
To motivate this statement, suppose that a tooth on the pinion of the input stage is submitted during 60 rotations to a positive torque, then for additional 60 rotations to a negative torque, and so on. If the input stage reduction is i = 4.0, then the pinion of Stage 2 will rotate four times lower; therefore, getting a torque change after 15 rotations. So, the frequency of alternate bending cycles is four times higher on Stage 2, and so on for the next stages.
Conclusion
AGMA and ISO gear ratings can be executed with load spectra (duty cycles)—based on Miner’s rule—as explained in ISO 6336-6 (Ref. 1). Load spectra may be defined by different methods. In this paper, the ability to generate a duty cycle from a time series (time-torque-speed data) is explained. Such a time series can be obtained by measurements of the operating loads on an application or by computer simulation.
If the torque and speed in such a time series are so, where the same flank is always in contact, a simple-count method can be used to generate the duty cycle. However, if the loaded flank is alternating, the considered tooth root is not only submitted to pulsating tensile stress (bending) but additionally to alternating bending and pulsating compressive stress. As the first step, all the significant torque changes must be extracted from the time series. For this, the rainflow method is used. As the second step, the result of rainflow must be converted into a definition fitting AGMA or ISO gear ratings. This means that for a bin of the load spectrum the nominal torque and the alternate bending factor must be determined.
Finally, the application of the method in gear calculations and in drive train analysis is discussed with an example.

References
- ISO 6336-6, 2019, “Calculation of load capacity of spur and helical gears—Part 6: Calculation of service life under variable load.”
- ISO 6336-1,2,3, 2019, “Calculation of load capacity of spur and helical gears—Part 1, 2 & 3.”
- AGMA 2001-D4, 2004, (or AGMA 2101) “Fundamental Rating Factors and Calculation Methods for Involute Spur and Helical Gear Teeth.”
- IEC 61400-4, 2012,“Wind turbines—Part 4: Design requirements for wind turbine gearboxes.”
- Amzallag, C., Gerey, J.P., Robert, J.L., Bahuaud, J. Standardization of the rainflow-counting method for fatigue analysis. Int J Fatigue 1994,16:287–93, https://doi.org/10.1016/0142-1123(94)90343-3
- Rainflow-counting algorithm is described in section 5.4.4. of ASTM E1049-85(1997), Standard Practices for Cycle Counting in Fatigue Analysis, ASTM International, West.
- KISSsoft gear calculation software, 2021, kisssoft.com.
- ISO 12110-2:2013, “Metallic materials—Fatigue testing—Variable amplitude fatigue testing—Part 2: Cycle counting and related data reduction methods.”


