Enhanced Calculation Method for Tooth Flank Fracture Risk with Consideration of Tensile Residual Stresses in Larger Material Depths
NomenclatureParametersρrel radius of relative curvature mm AFF material exposure according to ISO/TS 6336-4 Amax maximal material exposure in larger depth (y ≥ bH) according to ISO/TS 6336-4 bH half of the Hertzian contact width mm CHD case hardening depth at 550 HV mm M mean stress sensitivity
[advertisement]
MRS residual stresses sensitivity pH Hertzian pressure MPa R stress ratio y material depth at the flank mm Used AbbreviationsCHD Case hardening depth FVA Forschungsvereinigung Antriebstechnik (German Drivetrain Research Association) HV Vickers hardness ISO International Organization for Standardization RS Residual Stresses TFF Tooth flank fracture
[advertisement]
TS Technical specification |
Introduction and Motivation
Residual stresses are a major influencing factor on the load-carrying capacity of case-carburized gears. For the gear failure modes, tooth root breakage, and pitting, a significant improvement of the load-carrying capacity is possible with higher compressive residual stresses. The crack initiation for tooth root breakage at the surface of the tooth root fillet can even be prevented with shot peening. In these gears, the crack initiation is shifted to the material depth. The gear fatigue failure mode tooth flank fracture (TFF) is usually initiated in a larger material depth, where higher compressive residual stresses are not present anymore or are possibly tensile. It is very likely that the residual stresses have a similar effect on the TFF strength as for pitting and bending strength. However, neither the residual stresses in this larger depth are known yet, nor the effects of them on the TFF load carrying capacity. For these reasons, the tensile residual stresses have not yet been considered in the calculation of tooth flank fracture load capacity according to ISO/TS 6336-4.
This paper deals with the residual stress depth profiles in case-carburized gears, their effects on the fatigue behavior as well as the enhancement of ISO/TS 6336-4 to include the consideration of tensile residual stresses in the tooth core area. For this purpose, an equation is also presented with which these tensile residual stresses can be estimated so that they can be used in the enhanced evaluation of TFF risk.
State of the Art
Failure Mode Tooth Flank Fracture
Tooth flank fracture (TFF) is a gear fatigue failure mode with subsurface crack initiation. The crack characteristic is shown in Figure 1 (left). The breakage of the tooth, which consequently leads to the failure of the gear stage, occurs usually after several million load cycles. The crack initiation is mainly caused by the contact stresses, which can be described by the Hertzian theory. Hereby the maximal shear stress is placed in deeper material depth for larger relative radii of curvature. In addition, material conditions favor crack initiation at larger depths. In the near-surface region, the higher hardness and the compressive residual stresses prevent the formation of cracks, see Figure 1 (right), whereas in larger depths the hardness is decreased, and less compressive residual stresses are obtained. Consequently, the crack is initiated where the load-bearing capacity is reduced but the contact stresses are still sufficient to initiate the failure. Crack initiation can also be significantly promoted by inhomogeneities, defects, or non-metallic inclusions in the material.
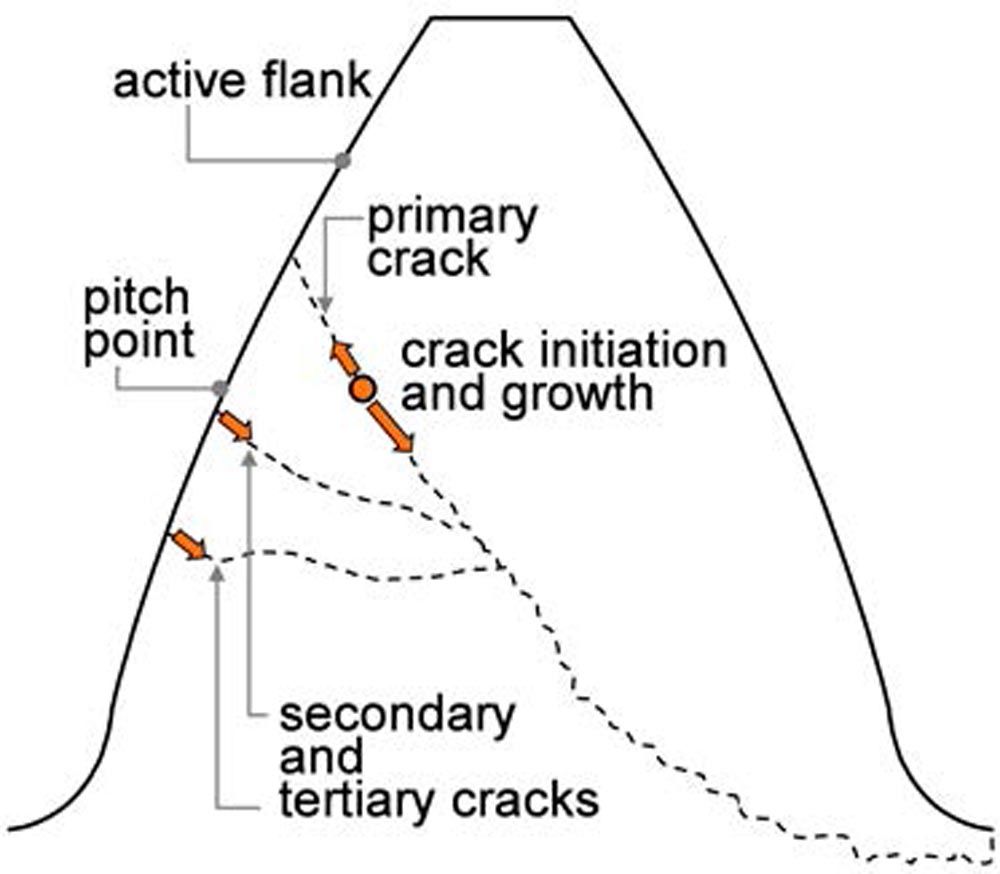
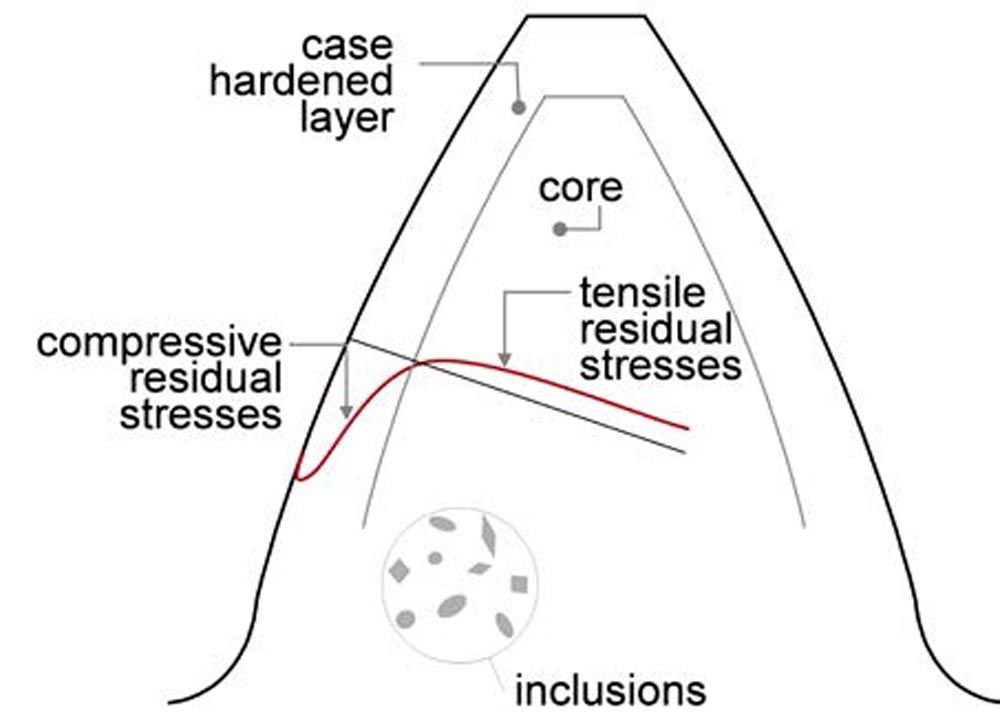
Figure 1—Schematic representation of a characteristic tooth flank fracture (left) and influencing factors depending on component material (right) (Ref. 1).
Residual Stresses in a Larger Depth of Case-Carburized Gears
Neutron and X-Ray Diffraction Measurement in Larger Material Depth
Residual stresses can be reliably measured with various methods in the near-surface region down to a limited component depth (Ref. 9). Reliable residual stress measurements at larger component depths are currently only possible with complex and expensive measurement methods, such as e. g. neutron diffraction. There are only a few neutron beam measurements of case-carburized parts or especially gears known.
In Tobie or Witzig (Refs. 2–3) the residual stresses in the cross-section of a module 8 mm gear for two different case hardening depths are published. The measurements show tensile residual stresses up to approximately 150 N/mm² in the core of the tooth. For the larger CHD the transition from compressive to tensile residual stresses is in larger material depth. Other measurement results also generally show tensile residual stresses in the core of case-hardened gear teeth (Ref. 4).
In Schwienbacher (Ref. 5), the module 3 mm gear (z1 / z2 = 67/69), which preferentially fails due to flank breakage was also measured at the cross section of a tooth. The measured residual stresses are shown in Figure 2. Tensile residual stresses in the core area are also evident here. The axial and radial stresses are between 50 N/mm² and 100 N/mm², whereas the stresses in the direction of the cross-section are near zero. The first and last measured values (in the marked area) can be neglected (Ref. 5).
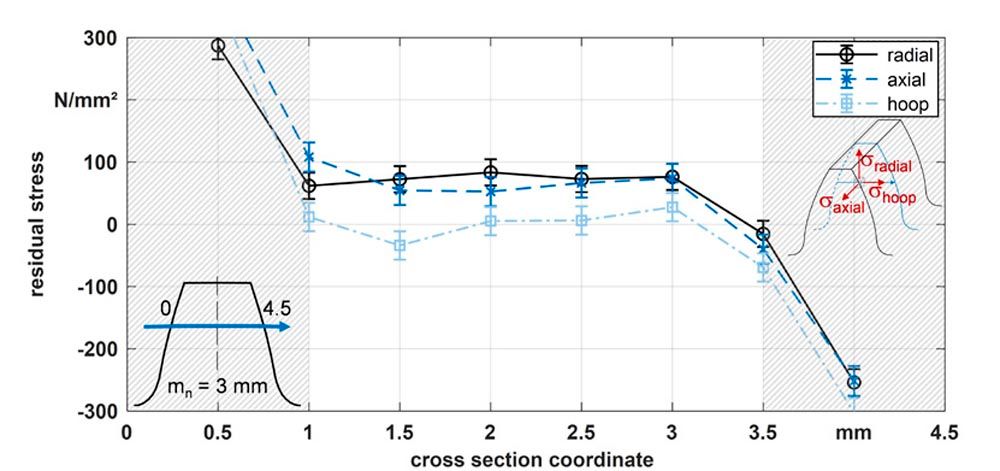
Figure 2—Measured residual stresses in a case-carburized gear of mn = 3 mm with neutron diffraction (Ref. 5).
By X-ray measurements, residual stresses can be reliably determined up to a component depth of approx. 0.3–0.5 mm. A residual stress depth profile is determined by material layer removal (etching) and measuring the surface residual stresses. For X-ray measurements at larger component depths, the influence of this layer removal on the residual stress state must be considered. Various proposals exist for this correction of the measured residual stresses, which have not yet been fully validated for residual stress measurements in case-hardened gears. Besides FE methods, the correction theory of Ref. 6 is the most widely used. This method was used on gears, for example, in Refs. 7–9.
In FVA 835 (Ref. 10), X-ray measurements of different-sized gears (mn = 3 mm and 18 mm) were carried out by the Leibniz Institute for Material-Oriented Technologies—IWT in Bremen. The case carburizing process differs in each case in the quenching medium (Oil at 90°C and 40°C), Polymer and Saltwater). All measurements show tensile residual stresses of approx. 100–200 N/mm² in depths larger than 2 CHD. The measured and corrected (correction of Moore and Evans [Ref. 6]) profiles are shown in Figure 3.
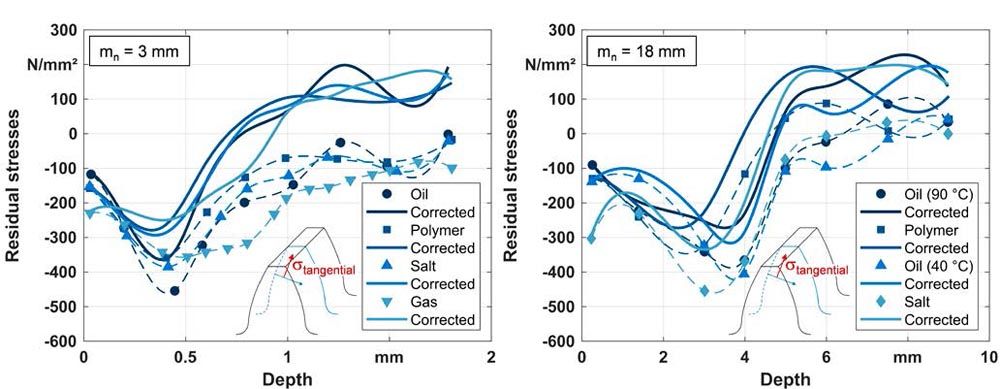
Figure 3—Measured and corrected residual stresses in case-carburized gears of mn = 3 mm, CHD ≈ 0.5 mm (left) and mn = 18 mm, CHD ≈ 3 mm (right) with X-ray diffraction (Ref. 10).
Calculation Approaches for Residual Stresses in Case-Carburized Gears
To date, only a few equations exist to estimate residual stress depth profiles. The residual stress depth profile is mostly derived from the hardness depth profile according to Lang (Ref. 11).This calculation approach shows good agreement with measured values for the compressive residual stresses near the surface and is used in the standard calculation methods of ISO 6336. The calculation of the residual stress depth profile from the hardness depth profile is comparatively simple and can also be performed with only the heat treatment parameters: surface hardness, core hardness and CHD. In this case, the hardness depth profile must first be measured or calculated, e.g., according to Lang, from the above-mentioned parameters. However, the hardness and residual stresses are decisive influencing variables in the TFF risk calculation and in some cases, it is disadvantageous to calculate the residual stresses from the hardness, since differences in hardness that are not significant from a measurement point of view can cause significant changes in the calculated risk of TFF.
The tensile residual stresses inside the tooth are not considered by the approach of Lang (Ref. 11). According to Lang, the tensile residual stresses are negligible for sufficiently large core cross-sections. However, in the case of small core cross sections (with a large case hardening depth, slender teeth, or near the tooth tip), significant tensile residual stresses may be present in the core area based on the presumed mechanical stress equilibrium. For case-hardened gears, extensions to Lang’s calculation approach have therefore already been proposed, in which the actual tensile residual stresses in the tooth core are considered.
Residual stress depth profiles with tensile residual stresses inside the tooth can be calculated, for example, according to Weber (Ref. 9), Konowalczyk (Ref. 12), or Böhme (Ref. 13). The principle of this calculation is shown schematically in Figure 4. Most calculation approaches are based on the compressive residual stresses calculated with the approach of Lang up to a certain depth (mostly 0.5 CHD) but show in part significant differences in their iteratively calculated tensile residual stresses based on a mechanical equilibrium. In addition, these approaches are not sufficiently verified. However, the authors address the problem of the unknown tensile residual stresses in the core of a case-carburized tooth.

Figure 4—Schematic representation of calculation approaches with consideration of tensile residual stresses (left: Weber [Ref. 9]; right: Konowalczyk [Ref. 12]).
Influence of Residual Stresses on Fatigue Strength
Compressive residual stresses have a significant positive influence on the fatigue limit. For case-hardened gears, this influence is investigated in various research projects regarding pitting damage (Refs. 12, 14–15) or tooth root breakage (Refs. 16–20). With shot peening (and other additional treatments), high compressive residual stresses can be induced up to a certain depth. For reference-sized shot-peened gears, the increase of permissible torque is often stated as approximately up to 50 percent compared to the unpeened variant (Refs. 19, 21). The influence of tensile residual stresses on the load-carrying capacity is less researched except in the context of the influence of grinding burn (Ref. 22), which causes tensile residual stresses in the near-surface region. However, it is generally assumed that tensile residual stresses lower the fatigue limit (Ref. 23).
The influence of the residual stresses on the fatigue limit strongly depends on the material (tensile) strength. In [24] is stated that residual stresses have a greater effect on the fatigue limit in higher-strength steels than in steels of medium tensile strength. In material conditions with low strength, the influence of residual stresses can be negligibly small [24]. Each increase of static strength increases the sensitivity to mean stress (Ref. 25). This effect is quantified by the residual-stresses sensitivity and can differ from the mean stress sensitivity according to Ref. 24 (compare Figure 5 [right]). For the influence of residual stresses, Macherauch and Wohlfahrt (Ref. 24) propose a residual-stresses sensitivity that depends on the tensile strength of the material. They do not assume vibration-stable residual stresses but consider a reduction of residual stresses by replasticization (Ref. 26).
In Fig. 5, the residual stress sensitivity and the mean stress sensitivity according to Ref. 24 are shown. The residual stress sensitivity describes the influence of residual stresses on fatigue strength in the same way that the mean stress sensitivity describes the influence of mean stresses on the alternating fatigue limit (see Haigh Diagram or Goodman diagram). Higher values indicate a greater effect. It should be noted that the relationship in Fig. 5 was determined for axial oscillating load. In the experimental determination of the sensitivity of the residual stress, too-low values can be measured due to the reduction of the residual stresses. If it is assumed that the residual stresses are stable and act like local mean stresses and that the local alternating strength is directly influenced only by the local residual stresses, then according to Winderlich (Ref. 25) the local residual stress sensitivity should not differ from the local mean stress sensitivity. Also, according to Bomas (Ref. 27), for example, stable residual stresses can be equated to mean stresses in their effect. According to Refs. 28–29 the mean stress sensitivity can be even higher for case-hardened steels under torsional loading e.g., M = 0.7 for Rm = 1,000 MPa.
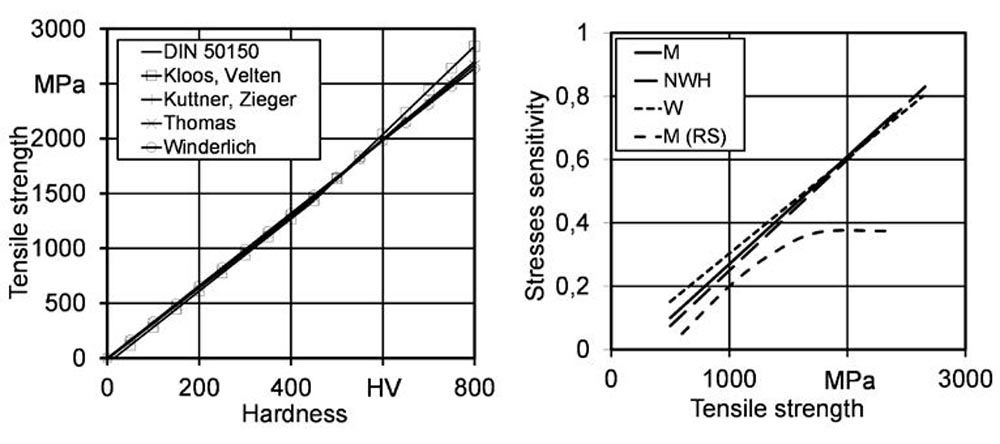
Figure 5—Relationship between hardness and tensile strength: DIN 50150; Kloos, Velten; Kuttner, Ziegler; Thomas; Winderlich (left). Relationship between tensile strength and mean stress sensitivity: Macherauch (M); Niemann, Winter, Höhn (NWH); Winderlich(W); Macherauch for residual stresses (M); (right). According to Ref. 30.
Various equations exist for calculating the mean stress sensitivity from the tensile strength as plotted in Fig. 5. The mean stress sensitivity can also be described from the ratio of the alternating strength and the oscillating strength. According to Liu and Zenner (Ref. 31), the mean stress sensitivity for smooth specimens under multiaxial loading can be calculated according to Equation 1.

(1)
where
β is the mean stress sensitivity acc. to Liu and Zenner (Ref. 31);
σw is the normal stress fatigue limit for completely reversed loading (R = -1);
σsch is the fatigue limit for oscillating loading (R = 0).
According to Dang Van (Ref. 32), the mean stress sensitivity depends on the ratio of the shear fatigue strength and the tension-compression fatigue strength:
 (2)
(2)
where
Mσ is the mean stress sensitivity for normal stresses;
σw is the normal stress fatigue limit for completely reversed loading;
𝜏w is the shear stress fatigue limit for completely reversed loading.
In addition, the mean stress sensitivity depends on the type of stress. In the Haigh diagram, the mean stress sensitivity for the effect of normal stresses also depends on the stress ratio R (Ref. 33) and for shear stresses, the influence of mean stresses is lower according to the FKM guideline (Ref. 34). The mean stress sensitivity for shear stresses is reduced by the ratio of the fatigue strength for shear and tension-compression after Equation 3 (Ref. 35).

(3)
where
M𝝉 is the mean stress sensitivity for shear stresses.
Conclusion: Various empirical equations have already been proposed for calculating stress sensitivity. However, the various influencing factors make it difficult to determine the stress sensitivity in experiments. For the complex stress state in the volume beneath the flank contact the influence of residual stresses is not known in detail to the author and probably impossible to determine exactly experimentally.
In summary, it can be stated that the following applies to the most commonly used methods or equations:
- The stresses sensitivity is in the range between 0 and 1.
- The material strength influences the stresses sensitivity. Higher stresses sensitivities are specified for higher-strength materials.
- The stresses sensitivity depends on the existing stress condition.
The mean stress sensitivities determined experimentally or calculated using various approaches (for a comparable strength) are similar for simple stress conditions.
A local residual stresses sensitivity is required for the TFF risk evaluation, since the stress state and the strength change with increasing material depth. A residual stresses sensitivity for flank fracture evaluation is not known. Therefore, it is assumed that:
- The residual stresses are oscillatory stable and act like local mean stresses.
- The residual stresses sensitivity for the multiaxial loading condition over the entire component depth is comparable to the residual stresses’ sensitivity for axial tension/compression loading.
Calculation of the Risk of TFF
Higher Order Calculation Model
The higher order calculation model was developed at the author’s institute about 40 years ago and has been continuously refined and enhanced. In the following, the basic concept of the model is described. Further descriptions of the model can be found in Refs. 2 and 36.
The higher-order model represents the rolling contact. In a stationary coordinate system, normal and shear stresses are calculated according to Föppl (Ref. 37). The occurring rotation of the principal stress axis system results in a change of the direction of the maximum shear stresses depending on the surface load relative to the considered volume element. After determining the individual components of the contact stresses and the (compressive) residual stresses, these are superimposed and the total stress components 𝝈x, 𝝈y, 𝝈z and 𝝉xy are obtained for each volume element over the material depth of each considered contact point.
The residual stress depth profile of tangential residual stresses is used as an input. The residual stresses in the axial direction are then calculated from the tangential residual stresses. When evaluating the TFF risk with the higher-order model, all residual stresses of the stress tensor can be taken into account. If the residual stresses normal to the flank are negligibly small, the axial residual stresses are calculated by default using the Poisson’s ratio o = 0.3 according to Equation 4. The axial and tangential residual stresses correspond to the principal residual stresses of the plane strain state. This simplification is permissible due to the lower influence of the axial residual stresses.


(4)
where
𝝈RSaxial is the residual stress in axial direction;
𝝈RStangential is the residual stress in tangential direction;
𝝂 is the Poisson’s ratio.
The choice of the equivalent stress hypothesis plays an important role in the calculation of the decisive stress. For the stress states resulting from rolling contact, the shear stress intensity hypothesis (SIH) acc. to Ref. 38 is a suitable and proven hypothesis. Equivalent stress hypotheses such as the octahedral shear stress hypothesis and the von Mises yield criterion are special cases of the SIH and are only conditionally suitable for complex multiaxial stress states with a rotating principal stress axis system. Other equivalent stress hypotheses can be found in the literature, such as the hypothesis according to Dang Van (Ref. 39).
According to Liu (Ref. 40), the SIH provides generally better accuracy in predicting the fatigue strength under multiaxial loading for all loading cases. This stress hypothesis of the integral strain, as well as the hypothesis of the critical plane can be derived from the Weakest-Link model. In the SIH, all section planes are considered and thus the requirement of invariance from the body-fixed coordinate system and the principal stress system is fulfilled. The decisive advantage is the accuracy for equal-frequency, frequency-differentiated and arbitrarily periodically oscillating stresses. Thus, for example, the consideration of a downstream stress state due to tooth deformation is made possible.
The shear stress intensity 𝝉eff is obtained by integrating the shear stresses 𝝉γα of the individual section planes over the spherical volume element with Equation 5. According to Oster (Ref. 41), the root mean square of the maximum stresses of all section planes is used. In this integral stress hypothesis, the stresses in all sectional planes on the spherical volume element are considered to be collectively relevant to damage (Ref. 31).

(5)
where
𝝉eff is the effective shear stress;
𝝉γα,max is the maximal shear stress in all planes;
𝜶, 𝜸 are the polar coordinates for the spherical volume element in a certain depth beneath the flank.
In the variant of SIH used, mean stresses or residual stresses are not directly considered. However, the effective shear stress, calculated from the residual stresses present, is subtracted from the effective shear stress, calculated from the load and residual stress condition. This double amplitude 𝝉eff DA is calculated according to Equation 6 and is to be understood as the alternating stress (stress amplitude).

(6)
where
𝝉eff DA is the local equivalent stress (double amplitude);
𝝉eff Load, RS is the local equivalent stress of load and residual stresses (upper total stress state);
𝝉eff RS is the local equivalent residual stress (lower total stress state).
The effective shear stress (double amplitude) calculated in this way, is then compared with an allowable shear stress. The allowable shear stress is proportional to the hardness. The empirical proportionality factor is composed of the factor for converting the hardness profile into a shear strength profile and the factor for considering the material. The hardness conversion factor was chosen empirically especially for the calculation of TFF risk. Thus, the local shear strength is derived from the local hardness according to Equation 7.

(7)
where
𝝉per is the local material shear strength;
K𝝉per is the hardness conversion factor;
Kmaterial is the material factor;
HV is the local Vickers hardness.
Practical Calculation Approach (of ISO/TS 6336-4)
Witzig (Ref. 3) has developed a standard-compliant, practice-oriented and non-iterative calculation approach for determining the risk of TFF for case-hardened cylindrical gears as part of the project FVA 556 I “Flank load capacity in larger material depth” (Ref. 42). This practical calculation approach is derived from the higher-order model for calculating the TFF risk. The simplified method has the advantage of numerous simplifications in the calculation equations, which ultimately allow a closed-form solution and thus enable industrial application. Both methods show comparable material exposure depth profiles especially in larger material depth (y ≥ bH). The practice-oriented calculation approach according to Witzig that is also the basis of ISO/TS 6336 4 was validated with the aid of the higher-order model with several million calculations. Overall, the results showed very good agreement for material depths y > 1…9 ∙ bH and within the following application limits:
- 500 N/mm² ≤ pH ≤ 3000 N/mm²
- 5 mm ≤ ρrel ≤ 150 mm
- 0.3 mm ≤ CHD ≤ 4.5 mm
Both methods are also calibrated by load carrying tests in test rigs and recalculations of failures and non-failures in different applications
The loading input variable represents the local Hertzian pressure to consider influences from flank corrections, shaft deformation, bearing stiffnesses and can be calculated using a suitable load distribution program, e.g., RIKOR (Ref. 43) or the equations in ISO 6336-4.
The material exposure AFF results from the comparison of the effective shear stress with a shear strength 𝝉per. In Eq. 8, the effective shear stress is composed of the total stress state 𝝉eff,L,pA , the influence of residual stresses on the total stress state 𝝉eff,L,stat.,pA (y) and the residual stress state 𝝉eff,RS,pA (y). In the calculations of the effective stresses only compressive residual stresses can be considered. The consideration of tensile residual stresses is not yet possible with this calculation approach.

(8)
where
AFF is the material exposure;
𝝉eff,L is the effective shear stress is composed of the total stress state without residual stresses;
𝜟𝝉eff,L,RS is influence of residual stresses on the total stress state;
𝝉eff,RS is the residual stress state;
𝝉per is the local material shear strength.
The shear strength is derived from the hardness depth profile, taking into account empirical factors in accordance with the higher-order model according to Equation 7.
The practice-oriented calculation approach according to Witzig was transferred with some minor changes into the technical specification ISO/TS 6336-4. This technical specification contains some guidance for the practical application of the calculation method. For example, procedures for estimating the hardness depth profile according to Lang (Ref. 11) and for estimating the residual stress depth profile (Ref. 44) are mentioned.
The result of the calculation, the material exposure depth profile AFF (y) indicates the risk of a subsurface failure. In reference fatigue tests with test gears, the fatigue limit for 50 percent failure probability regarding TFF correlates reproducibly with values of the maximum material exposure in larger material depth of AFF, max ≈ 0.8. However, due to further influencing factors for TFF risk in applications, such as variable torque, overloads, a significantly lower failure probability, size effects or longer lifetimes than previously investigated, the maximum allowable material exposure is lower. Further information and notes on the use of the ISO/TS 6336-4 and the interpretation of a material exposure depth profile can be found in Ref. 45.
Aim of the Investigation
From the state of the art, it is clear there are tensile residual stresses present in the core of a case carburized gear. So far, these tensile residual stresses are not considered in the calculation of TFF risk. It is also known that compressive and consequently possibly tensile residual stresses have a major influence on fatigue strength. In experimental investigations of tooth root breakage high compressive residual stresses lead to improvement of up to 50 percent in applicable torque. For the failure mode TFF a more complex stress condition is present beneath the flank. For this complex stress state there are various proposals of multiaxial fatigue criteria and on how to consider the residual stresses in them. But so far, the residual stresses in larger depth cannot be predicted with any certainty, which makes the evaluation of fatigue criteria for TFF even more difficult.
The aim of this work is first to predict residual stress depth profiles with tensile residual stresses present in the core of case carburized gears and second to consider the tensile residual stresses in the higher order calculation model of the TFF risk within the SIH and subsequent for the practical calculation approach of ISO 6336-4. This leads to an enhanced calculation method, that improves the current method and opens up new calculation possibilities.
Estimation of Residual Stresses in Case-Carburized Gears
In FVA 835 (Ref. 10), a simulation model for the residual stresses formation in the case carburizing process was built by the Chair and Institute for Materials Applications in Mechanical Engineering—IWM at RWTH Aachen University. The model is based on extensive simulative as well as experimental research. To characterize the material behavior of 18CrNiMo7-6 (1.6587), investigations with dilatometer specimens were carried out. These include the determination of flow behavior, transformation kinetics, transformation strains and thermal strains, quenching and tempering behavior. These properties were determined for samples with carbon contents between 0.18 and 0.82 mass percent carbon as a function of the relevant microstructural compositions and thermal conditions. The simulation model was validated with residual stresses measurements of module 3 mm and module 18 mm gears.
With this simulation model the residual stresses were simulated in different gear geometries for several CHDs. In addition, the influence of the carbon content depth profile and the quenching medium were simulated. Based on the simulated residual stresses a practical approach for the calculation of residual stress depth profiles in larger material depth was developed.
First, characteristic points of the simulated residual stress depth profile were defined. These characteristic points can be described by the component depth and the residual stress value. Figure 6 shows an example of the characteristic points for a simulated residual stress depth profile. The residual compressive stresses at the component surface are described by 𝝈0. Since several simulations showed a compressive residual stress maximum below the surface, an additional characteristic point was defined here. The pressure maximum is described by a residual compressive stress 𝝈D at a component depth yD. These points near the surface are not directly relevant for the TFF evaluation, since the crack origin is located at a larger depth. However, using these points showed a higher agreement to the simulated residual stress depth profile in the region between compressive maximum and compressive to tensile residual stress transition. The transition from compressive to tensile residual stresses, where the residual stresses are zero, is described by yDZ. The tensile residual stresses inside the tooth are described by 𝝈Z, which indicates the maximum tensile residual stresses inside the tooth. The position of the maximum tensile residual stresses is usually in the center of the tooth.
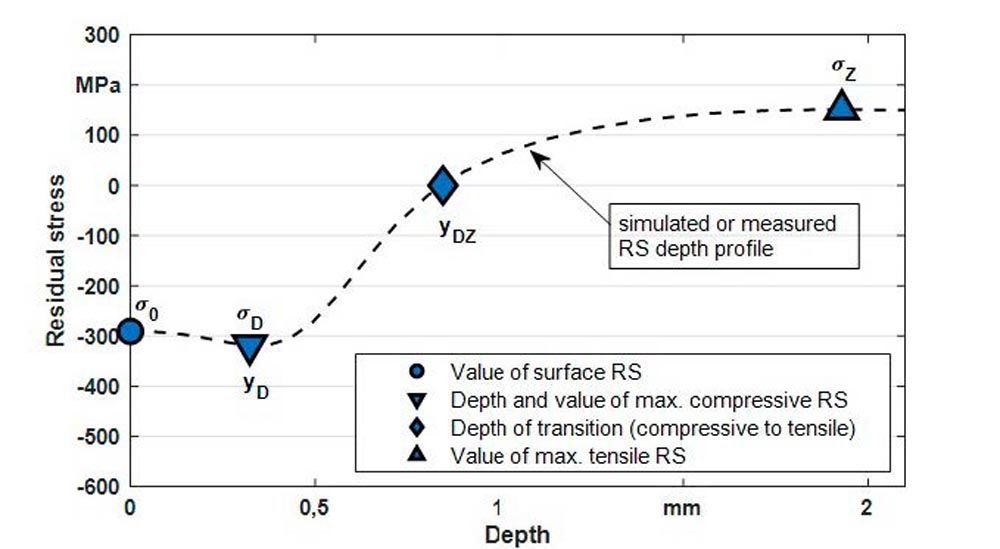
Figure 6—Chosen characteristic points for the description of a simulated residual stress depth profile.
With the characteristic points, the depth profile of the tangential residual stresses can be easily calculated over the component depth y. A logistic function was adapted in such a way that the characteristic points can be inserted directly or via the parameters 𝜶, 𝜹, k. The adjusted equation is given by Equation 9.

(9)
where
𝝈RS,tan is the tangential residual stress at the depth y;
𝝈Z is the tensile residual stress in the tooth core;
𝜶,k,𝜹 are parameters of the equation that are calculated.
The depth y is given in millimeters and the residual stress in N/mm². The parameter 𝜶 defines the compressive residual stresses at the surface. If the maximum residual compressive stress is directly at the surface, the following applies:

 (10)
(10)
where
𝝈D is the maximal compressive residual stress near the surface.
For a compressive residual stress maximum below the surface, it is suggested to use the average of 𝝈0 and 𝝈D for the residual stresses at the surface.
 (11)
(11)
where
𝝈0 is the compressive residual stress at the surface;
𝝈D is the maximal compressive residual stress near the surface;
w is the parameter to adjust the compressive residual stresses.
The parameter k is calculated as follows:

(12)
where
yD is the depth y of the maximal compressive residual stresses;
yDZ is the depth of the transition from compressive to tensile residual stresses;
r is the parameter for the slope in the transition from compressive to tensile residual stresses.
The parameter d can be calculated from all other parameters and characteristic points as follows:

(13)
In this calculation of tangential residual stresses, a residual stress depth profile can be calculated by specifying the characteristic points. The values of the surface residual stresses can be adjusted as desired without changing the further residual stress depth profile at larger depth. Thus, the approximation equation can be used to generate arbitrary residual stress depth profile by specifying the five values 𝝈0, 𝝈D, yD, yDZ, and 𝝈Z. The parameters r and w can be used for a better fit to the desired depth profile. Reasonable residual stress depth profiles usually result for 0.4
In Figure 7 a residual stress depth profile calculated with Equation 9, as well as the used input parameters are shown. In addition, the residual stress profile calculated with Lang’s approach is shown, where no tensile residual stresses are considered. This simulated residual stress depth profile applies for a heat treatment with oil quenching and a carbon depth profile with 0.7 mass percent carbon content at the surface (Ref. 10).
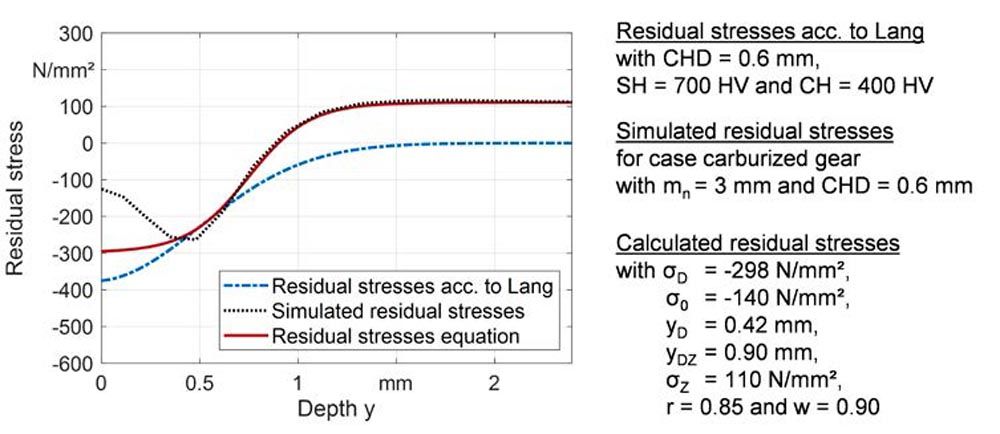
Figure 7—Comparison of residual stress depth profiles for a case carburized mn = 3 mm gear with CHD = 0.6 mm: Calculated with Lang’s approach based on the calculated hardness profile, result of simulation in FVA 835 and calculated with Equation 9.
If the characteristic points are unknown, they can be calculated based on the simulated residual stresses for different gearings and CHDs. For this purpose, correlations were derived from the simulated residual stresses. In FVA 835 (Ref. 10), these equations were derived to calculate the inputs for the shown equations (𝝈0, 𝝈D, yD, yDZ, 𝝈Z,w, r) based on only the module mn and the CHD. Thus, residual stress depth profiles can now be estimated for case-hardened gears based on module and CHD.
Enhancement of the Calculation Methods for Tooth Flank Fracture Risk
First, the higher order calculation model for tooth flank fracture was extended to consider tensile residual stresses in larger material depth. After that, the practical calculation approach (of ISO 6336-4) was adapted as well. The modifications are described in the following.
The effective shear stress calculated with SIH is, by definition, without a sign, so that the sign of the existing residual stresses must be considered when calculating the double amplitude. The calculation of the double amplitude is based on the concept of subtracting the effective residual stress state from the effective loading and residual stress state. If the residual stresses change the sign at transition from compressive to tensile residual stresses some adaptations are necessary. The higher-order model has been extended so that tensile residual stresses can be taken into account in a material-physical way. In the extension, the tensile and compressive residual stresses are considered via a residual stresses sensitivity. Up to now, residual stresses were considered without residual stresses sensitivity. This corresponds to the extended calculation with a residual stresses sensitivity MRS = 1. Equation 15 shows the enhanced calculation of the double amplitude in the higher-order model. In Equation 15, the residual stress state is multiplied by the residual stresses sensitivity MRS. In addition, the sign of the effective shear stress calculated from the tensile residual stresses is therefore adjusted.


(14)
where
𝝉eff DA is the decisive equivalent stress (double amplitude);
𝝉eff L, RS is the equivalent stress of loading stresses and residual stresses acc. to the SIH;
𝝉eff RS is the equivalent stress of the residual stresses acc. to the SIH;
MRS is the residual stresses sensitivity.
This residual stresses’ sensitivity MRS is also used in the calculation of the equivalent stress of loading stresses and residual stresses 𝝉eff, L, RS. Here, the residual stresses are multiplied by the residual stresses sensitivity before superimposing with the load stresses. By extending Equation 6 and by adding a residual stresses sensitivity to the calculation of the total stress state, the influence of residual stresses on TFF load capacity is considered.
In the extended higher-order model, the residual stresses are considered via a proposed residual stresses sensitivity. The residual stresses sensitivity is calculated from the tensile strength, which is calculated from the hardness depth profile. Various approximations exist in the literature for calculating the tensile strength from the hardness. However, most approximations show a comparable relationship between hardness and tensile strength. For the calculation of the tensile strength, the calculation (Equations 16 and 17) according to Velten (Ref. 46) (compare Fig. 3) for case-hardened steels is proposed. Comparable relations are stated in various works.

(15)

(16)
where
Rm (y) is the local tensile strength;
HV(y) is the local Vickers hardness.
Since no data for residual stresses sensitivities for the flank fracture evaluation are known in the literature, it is suggested to consider the residual stresses as mean stresses with the mean stress sensitivity for axial load. The residual stresses sensitivity can thus be derived from the tensile strength Rm using, for example, Equation 18 according to NWH (Ref. 47) (compare Figure 3).

(17)
where
MRS is the residual stresses sensitivity;
Rm (y) is the local tensile strength.
The resulting relationship between hardness and residual stresses sensitivity is shown in Figure 8. The tensile strength was calculated from the hardness according to Velten (Ref. 46) and the residual stresses sensitivity from the tensile strength according to NWH (Ref. 47). Thus, it is assumed that the residual stresses are vibrationally stable and act like local mean stresses. Furthermore, it is assumed that the residual stresses sensitivity for the flank fracture evaluation is comparable to the residual stresses’ sensitivity for axial loading.
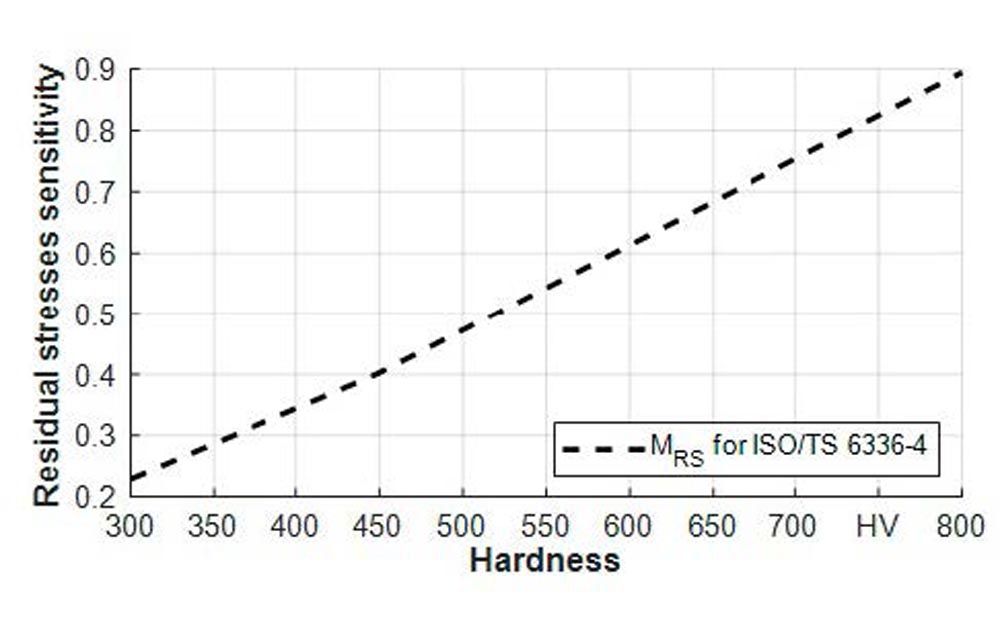 Figure 8—Plot of residual stresses sensitivity MRS for the tooth flank fracture evaluation as a function of hardness.
For the adaption of the practical approach some changes in definitions and in the equations are necessary. The adjustments described for the proposed expansion are listed below:
I. |𝝈RS, max| : Is defined as the absolute value of the maximum compressive residual stresses, which is used for the calculation of KpH (and K2)
II. For the calculation of the influence of the residual stresses on the local equivalent stress 𝜟𝝉;eff,L,RS,CP the factor K2 = 0:

(18)
where
𝜟𝝉;eff,L,RS,CP (y) is the influence of the residual stresses on the local equivalent stress;
|𝝈RS (y)| is the absolute value of the residual stress.
III. For the calculation of the local equivalent stress 𝝉;eff,CP, the local residual stresses sensitivity MRS(HV(y)) (acc. Eq. 17) is added. In addition, a distinction is made between component depths with compressive and tensile residual stresses. This results in the following extended equations:

(19)

(20)
where
MRS (HV) is the local residual stresses sensitivity calculated from the local hardness.
For the calculations according to ISO/TS 6336-4 the hardness depth profile of the investigated gearing should be approximated with a hardness calculation approach, such as Thomas’ approach. In some cases, another hardness approach such as Lang’s approach may be more suitable. The use of a measured profile is not recommended because the usually unsmoothed profile affects the material exposure curve and makes its interpretation difficult. However, this approximation should also be done for the residual stresses’ depth profile when tensile residual stresses should be considered. Therefore, the approximation with Equation 9 is recommended.
The use of a residual stresses sensitivity of MRS = 1 in the range of compressive residual stresses and a residual stresses sensitivity derived from the hardness MRS(HV) in the range of tensile residual stresses leads to a discontinuity in the stress depth profiles at the transition from compressive to tensile residual stresses. This discontinuity can be eliminated if, for example, MRS = 1 is used in the range y ∙bH, MRS(HV) is used in the range of tensile residual stresses and interpolation is performed in between. However, in the investigated cases the choice of MRS in the area of compressive residual stresses does not affect the maximum material exposure in larger depth but has the advantage, that the calculation method without consideration of tensile residual stresses (acc. to ISO/TS 6336-4 (2019)) and the enhanced calculation method show the same results when only considering compressive residual stresses. This means the proposed calculation method is only an enhancement for the current calculation method, which allows the consideration of tensile residual stresses in the core if known.
In Figure 9, the recalculation of a gearing failed due to TFF in experimental investigations is shown. For the calculations without consideration of tensile residual stresses (RS profile acc. to Lang), a maximal material exposure of Amax = 0.9 is calculated. The material exposure depth profiles of ISO/TS 6336-4 and the higher order model are comparable. For the calculation with consideration of tensile residual stresses a residual stress depth profile was calculated with the herein proposed equation. Both enhanced models, that consider the tensile residual stresses with the residual stresses sensitivity MRS(HV) show comparable material exposure profiles with a maximum material exposure of Amax = 1.1. The enhanced method of ISO 6336-4 usually shows comparable or identical results as the enhanced higher order model. This also shows that a new material exposure limit in larger depth (y ≥ bH) has to be defined for the enhanced calculation methods.
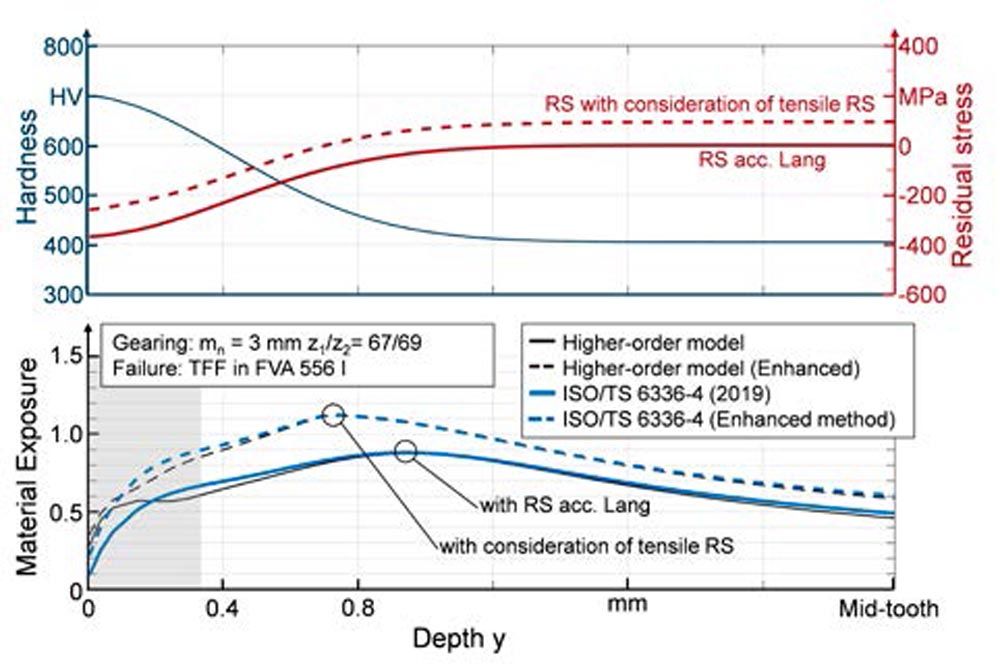
Figure 9—Comparison of calculated material exposure depth profiles: Higher-order model and ISO/TS 6336-4 and their enhanced methods including tensile residual stresses in the core area.
Validation of the Enhanced Calculation Methods with Recalculations of Gears
Chosen Gearings and Failure Modes
The proposed enhanced calculation method was extensively validated with various recalculations of TFF failures as well as non TFF failures. In the following, four different gearings are presented. The main geometry of the gearings as well as the data needed for the calculation methods is shown in Table 1. Gearing V01 is a reference gearing for pitting tests. This gearing was tested in various research projects and TFF failure has not been observed. The recalculation for this gearing is performed at the maximum tested torque where no TFF but pitting failure has occurred. The other gearings are known test gearings for TFF whereas the gearing V08 is relatively new. These gearings are recalculated at the fatigue limit regarding TFF. In addition, Hertzian pressure calculated according to the corresponding pinion torque is also given in Table 1.
Description | Symbol | Unit | Value for gearing: | |||
V01 | V04 | V09 | V08 | |||
center distance | a | mm | 91.5 | 200 | 200 | 91.5 |
normal module | mn | mm | 4.5 | 3 | 5 | 3 |
number of teeth | z1 / z2 | [–] | 16 / 24 | 67 / 69 | 40 / 41 | 29 / 30 |
tooth width | b | mm | 14 | 18 | 18 | 13 |
normal pressure angle | a | ° | 20 | 20 | 20 | 23.5 |
helix angle | b | ° | 0 | 0 | 0 | 0 |
CHD | mm | 0.78 | 0.5 | 0.65 | 0.36 | |
surface hardness | HV | 740 | 700 | 695 | 735 | |
core hardness | HV | 400 | 405 | 410 | 450 | |
material | 16MnCr5 | 18CrNiMo7-6 | 18CrNiMo7-6 | 20MnCr5 | ||
material factor | Kmat | 1.0 | 1.13 | 1.13 | 1.0 | |
failure mode | Pitting | TFF | TFF | TFF | ||
torque (at pinion) | T1 | max. applied | fatigue limit | fatigue limit | fatigue limit | |
Hertzian pressure | pH | N/mm² | 1897 | 1488 | 1575 | 1417 |
Table 1—Gearing data for the calculation.
Results of Recalculations of Load Carrying Capacity Investigations
In Figure 10, the maximal material exposure for recalculations of experimental investigations regarding the load carrying capacity is shown. The bars show the maximal material exposure in larger material depth (y ≥ bH) according to ISO/TS 6336-4 (2019) and according to the herein proposed enhanced method with consideration of tensile residual stresses. The hardness depth profile was approximated with Lang’s approach in all calculations. The residual stresses are calculated according to Lang from the hardness on the one hand and on the other hand according to Equation 9. The depth profiles for gearing V04 are exemplary shown in Figure 9. The circles in Figure 10 show the near surface maximal material exposure in a depth of y 1∙bH, which can indicate a near surface failure.
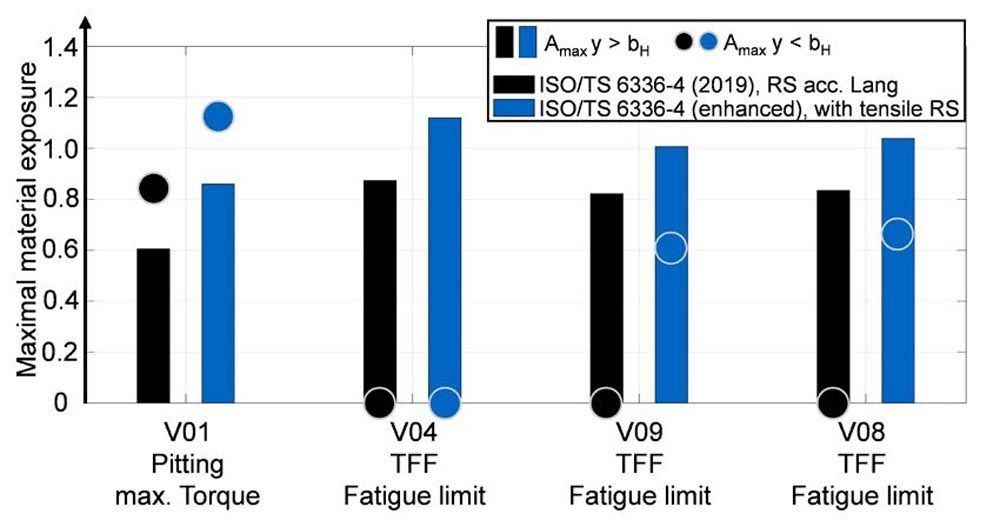
Figure 10—Comparison of calculated maximal material exposure values close to the surface and in larger depth acc. to ISO/TS 6336-4 and the proposed enhanced method.
The gearing V01 was investigated in FVA 125 III (Ref. 48) regarding pitting strength. Without consideration of tensile residual stresses a maximal material exposure in larger depth of Amax = 0.6 is shown. With consideration of tensile residual stresses the material exposure maximum in larger depth increases to Amax = 0.86. For the calculation of the risk of TFF of a gearing the maximal material exposure in a larger depth is decisive. However, the maximal exposure in depths y H can indicate a surface failure such as pitting. For this gearing a near surface material exposure maximum exists, that is even significantly higher than the maximum at larger depths. This is in good correlation to the observed pitting failures (no TFF) for this gearing in the test runs.
For the gearings that showed TFF in experimental investigations the recalculation was done with the load at the determined fatigue limit. The maximal material exposure in larger depth without consideration of tensile residual stresses is Amax ≥ 0.8 in all cases. The maximal material exposure with consideration of tensile residual stresses is for the TFF endurance limit Amax ≥ 1.0.
For all examples the near surface maximum material exposure is significantly smaller compared to the maximum value in larger material depth. This agrees with the observed failure mode TFF (no pitting) for all these gearings.
Based on the recalculation of experimental investigations it can be stated that with the herein proposed method for considering the tensile residual stresses in the core area, the maximal material exposure in larger material depth is increased by approximately 20 percent.
Based on these results a maximal material exposure limit for all documented test gears, which have been tested under constant load and a failure probability of 50 percent in larger depth Amax = 1.0 can be assumed (tensile RS included in the calculation). However, for the design of gears in industrial applications a material exposure limit of 1.0 should not be used. For the gears in practical applications, the greatest uncertainty results from the unknown and varying torque causing TFF. Furthermore, the associated failure probabilities are unknown and are certainly significantly lower than the 50 percent used as a basis for the load-carrying capacity investigations with test gears and consequently the definition of the material exposure limit. In addition, uncertainties arise from the unknown hardness depth profile, which can even be different for individual gears, as well as from various other influencing factors that cannot yet be considered with certainty in the TFF assessment. On the one hand, these can have an influence on the material side, such as non-metallic inclusions, when calculating the material strength profile. On the other hand, size-dependent factors (e. g., statistical or energetic size effect) are also to be expected but have not yet been determined.
For the application of the enhanced calculation method in industrial applications, it is therefore recommended that a material exposure limit at a larger depth of Amax = 0.8 should not be exceeded. In addition, a corresponding minimum safety factor should be considered depending on the available experience and the knowledge of the required input variables for the calculation.
Further Theoretical Investigations Only Possible with the New Approach
Influence of the Hardness Depth Profile on the Tooth Flank Fracture Risk
The residual stress depth profile, especially in larger material depth is mostly uncertain. The hardness profile, on the other hand, is mostly known but subject to scattering. For the calculation of TFF risk according to ISO/TS 6336-4 it is recommended to approximate the measured hardness depth profile by Thomas’ approach. With ISO/TS 6336-4 (2019) smaller deviations in the hardness depth profile (in larger material depth) already led to relatively strong differences in the calculated material exposure depth profile. The reason for this was the calculation of residual stresses from the hardness depth profile.
In Figure 11 the influence of the hardness depth profile on the material exposure depth profile is illustrated using the example of the hardness profiles calculated with Lang’s and with Thomas’ approach. Thomas’ hardness depth profile shows a lower hardness at the transition to the core hardness than according to Lang. This small deviation is consequently also transferred to the residual stresses and leads to a major difference in the material exposure.
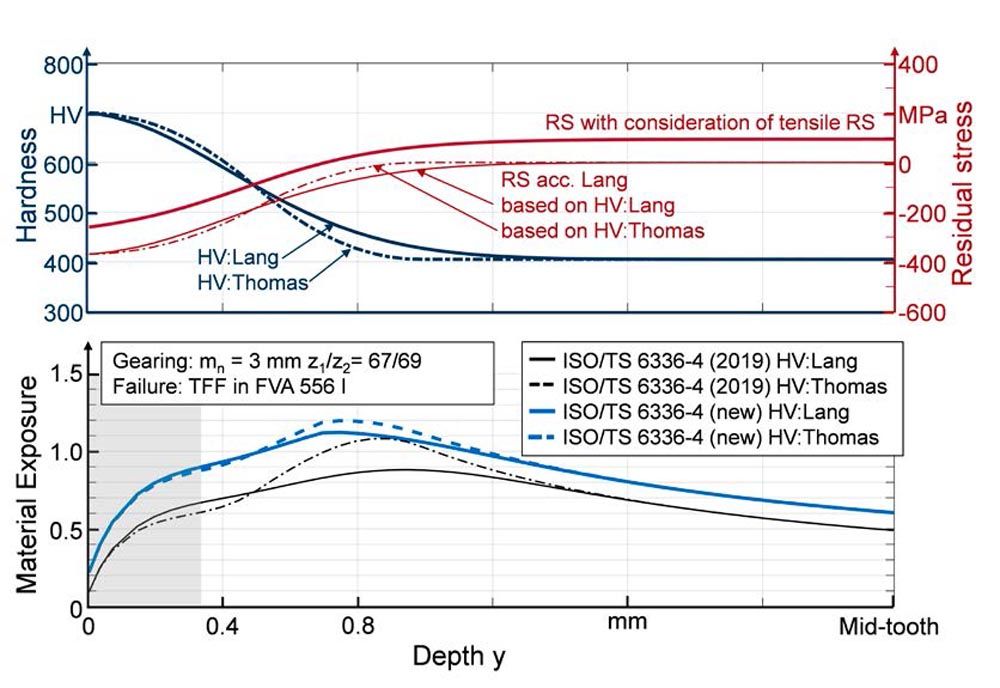
Figure 11—Influence of the hardness depth profile on the material exposure for the previous and presented enhanced calculation method. In grey the near surface area (depth up to 1 . bH).
With the enhanced method, the residual stresses are calculated more independently from the hardness profile. This makes it possibly easier to get an estimation of the TFF risk without knowing an exact hardness profile. The material exposure depth profiles calculated with the enhanced method are approximately 20 percent higher but show only minor deviations in the material exposure profile for both hardness depth profiles.
The smaller shift of the maximum exposure in direction to the surface (when comparing the method of 2019 and enhanced method) is caused by the assumption of the residual stress depth profile. Here the residual stresses with consideration of tensile residual stresses according to Equation 9 have their transition from compressive to tensile or to zero nearer to the flank surface.
Results, Conclusions, and Outlook
This paper presents an enhancement of the calculation approach for tooth flank fracture risk by considering tensile residual stresses in larger material depth. The extension of the practical approach according to ISO/TS 6336-4 is still based on the higher-order calculation approach, which was previously able to take tensile residual stresses into account in principle but was not yet validated for this purpose. In addition, a simple non-iterative equation for estimating a residual stress depth profile is presented. With this equation measured or simulated residual stress depth profiles can be approximated including tensile residual stresses in the core area.
Since the calculation of the material strength was not adjusted, the extended approach results in a new maximum material exposure limit when tensile residual stresses are considered. For the determination of this limit, recalculations of TFF load carrying capacity investigations were carried out.
The enhanced method brings several decisive advantages, which are shown. First, the existing tensile residual stresses inside the tooth are taken into account as a function of gear size and CHD on the basis of extensive numerical and experimental investigations, thus increasing the reliability of the calculation method. Furthermore, uncertainties in the hardness depth profile have a significantly lower effect on the calculated material exposure since the residual stresses are not calculated in direct dependence on the hardness depth profile. In addition, it is now possible to theoretically investigate the optimal CHD, since the TFF risk of very high CHD’s no longer leads to very low maximum material exposures regarding TFF, which cannot be expected in reality but was the case before the enhancement of the calculation method. With the enhanced method, taking tensile residual stresses into account, as the CHD increases, the TFF risk approaches a limit value at which the TFF risk no longer decreases. The theoretical investigation of an optimal CHD regarding TFF is possible now possible and is to be examined in detail next.
Acknowledgements

This research work was funded equally by the Arbeitsgemeinschaft industrieller Forschungsvereinigungen e.V. (AiF), the German Federal Ministry for Economic Affairs and Climate Action (BMWi, IGF no. 20150N) and the Forschungsvereinigung Antriebstechnik e.V. (FVA). The results shown in this work were taken from the research project FVA 835 (Ref. 10).

Bibliography
- Müller, D.,2021, “Tooth Flank Fracture—Design Process for a New Test Gearing and First Test Results,” AGMA Fall Technical Meeting 21FTM03.
- Tobie, T., Stahl, K., Höhn, B.-R., 2013, “Tooth Flank Breakage: Influences on Subsurface Initiated Fatigue Failures of Case Hardened Gears,” ASME 2013, Portland, Oregon, USA.
- Witzig, J., 2012, “Tooth flank fracture—limit of load carrying capacity in the material depth,” Ph.D. thesis, Technical University of Munich.
- Mukai, R., Ju, D. Y., Suzuki, H., 2009, “Inside Residual Stress Analysis of Carburizing-Nitriding Quenching Spur Gear by Neutron Diffraction Method,” MSF, 614, pp. 149–154.
- Schwienbacher, S., Tobie, T., Höhn, B.-R., Hofmann, M., 2006, “Measurement of Residual Stresses in Case Hardened Test Gears with Neutron-Diffractometer, Proposal No. 397.” MLZ User Office, FRM II Stress-Spec, Munich.
- Moore, M. G., Evans, W. P., 1958, “Mathematical Correction for Stress in Removed Layers in X-Ray Diffraction Residual Stress Analysis,” SAE Transactions, Vol. 66, pp. 340–345.
- Batista, A. C., Diaz, M. A., Lebrun, J. L., Le Flour, J. C., Inglebert, G., 2000, “Contact fatigue of automotive gears: evolution and effects of residual stresses introduced by surface treatments,” Blackwell Science Ltd., Fatigue & Fracture of Engineering Materials & Structures, Vol. 23, pp. 217–228.
- Savaria, V., Bridier, F., Bocher, P., 2016, “Predicting the effects of material properties gradient and residual stresses on the bending fatigue strength of induction hardened aeronautical gears,” International Journal of Fatigue, Vol. 85, pp. 70–84.
- Weber, R., 2015, “Design concept against volume failure in case-hardened spur gears,” Ph.D. thesis, Universität Kassel.
- Iss, V., Müller, D., Haupt, N., Rajaei, A.,Tobie, T., Steinbacher, M.,Broeckmann, C. Stahl, K, Fechte-Heinen, R., 2022, “Extended calculation of the tooth flank fracture risk of case-hardened gears with consideration of the residual stresses in larger material depths,” FVA, Vol. 1507.
- Lang, O. R., 1988, “Calculation and Design of Inductive Hardened Components,” Kloos, K. H.; Grosch J.: Induktives Randschichthärten, 23–25 March 1988, Munich: Arbeitsgemeinschaft Wärmebehandlung und Werkstofftechnik (AWT) conference Proceedings, pp. 332–348.
- Konowalczyk, P., 2018, “Pitting and tooth flank fracture load capacity of large modul spur gears,” Ph.D. thesis, Edition Wissenschaft Apprimus, Band 21/2018. Apprimus Verlag, Aachen.
- Böhme, S. A., Vinogradov, A., Papuga, J., Berto, F., 2021, “A novel predictive model for multiaxial fatigue in carburized bevel gears”, Fatigue & Fracture of Engineering Materials & Structures, Vol. 44, pp. 2033–2053.
- Elstorpff, M.-G., 1993, “Influences on the pitting strength of case carburized gears up tot he high cycle fatigue,” Ph.D. thesis, Technical University of Munich.
- Tobie, T., 2001, “Influence of the case hardening depth on the pitting strength and tooth bending strength of larger gears,” Ph.D. thesis, Technical University of Munich.
- Höhn, B.-R., Tobie, T., Stenico, A., Lombardo, S., 2009, “Influence of Residual Stresses on Tooth Root Bending Strength of Case Hardened Gears,” JSME International Conference on Motion and Power Transmissions.
- Bretl, N. Schurer, S., 2013, “Investigations on Tooth Root Bending Strength of Case Hardened Gears in the Range of High Cycle Fatigue,” AGMA Fall Technical Meeting.
- Bretl, N., Tobie, T., Höhn, B.-R, 2008, “Investigations on Tooth Root Bending Strength of Case Hardened Gears in the Range of High Cycle Fatigue,” FVA, Vol. 851.
- Stenico, A., Krug, T., Tobie, T., Höhn, B.-R, 2004, “Influence of residual stresses on the tooth root bending strength smaller sized gears,” FVA, Vol. 745.
- Güntner, C., Tobie, T., Stahl, K., 2017, “Influences of the Residual Stress Condition on the Load Carrying Capacity of Case Hardened Gears Hardened Gears,” AGMA Fall Technical Meeting.
- Townsend, D. P., Zaretsky, E. V., 1982, “Effect of shot peening on surface fatigue life of carburized and hardened AISI 9310 spur gears,” NASA Technical Paper.
- Schwienbacher, S., 2008, “Influence of grinding burn on the flank load carrying capacity of case carburized gears,” Ph.D. thesis, Technical University of Munich.
- Kloos, K. H., Broszeit, E., 2004, “On the question of rolling contact fatigue.”
- Macherauch, E., Wohlfahrt, H., 1985, “Fatigue behavior of metallic materials,” Eigenspannung und Ermüdung.
- Winderlich, B., 1990, “The concept of local fatigue strength and its application to martensitic surface coatings, in particular laser hardening coatings,” Mat.-wiss. u. Werkstofftech., Vol. 21, No. 10, pp. 378–389.
- Mourier, C., 2002, “Nominal stress-independent lifetime prediction based on linear elastic finite element method calculations,” Ph.D. thesis, Technical University of Berlin.
- Bomas, H., Linkewitz, T., Mayr, P., 1998, “Evaluation of the influence of residual and mean stresses on the fatigue strength of 42CrMo4 steel in the quenched and tempered condition,” Mat.-wiss. u. Werkstofftech., Vol. 29, No. 5, pp. 270–276.
- Götz, S., Eulitz, K.-G., 2020, “Betriebsfestigkeit,” Springer Fachmedien Wiesbaden.
- Berner, M., Eulitz, K.-G., 2011, “Investigations on test time reduction and service life estimation on case-hardened shafts under torsional load.”
- Hertter, T., 2003, “Computational strength verification of the fatigue load capacity of quenched and tempered and case-hardened gears,” Ph.D. thesis, Technical University of Munich.
- Liu, J., Zenner, H., 1993, “Calculation of fatigue strength under multiaxial loading—Part 1,” Mat.-wiss. u. Werkstofftech., Vol. 24, No. 8, pp. 296–303.
- Conrado, E., Foletti, S., Gorla, C., Papadopoulos, I. V., 2011, “Use of multiaxial fatigue criteria and shakedown theorems in thermo-elastic rolling–sliding contact problems,” Wear, Vol. 270, Nos. 5–6.
- Läpple, V., 2016, “Introduction to strength of materials,” Springer Vieweg, Wiesbaden.
- Hänel, B., 2003, “Computational strength verification for machine components made of steel, cast iron and aluminum materials,” Ph.D. thesis, Technical University of Clausthal.
- Haibach, E., 2006, “Betriebsfestigkeit - Verfahren und Daten zur Bauteilberechnung,”. VDI-Buch. Springer, Berlin.
- Boiadjiev, I., Stemplinger, J.-P., Stahl, K., 2015, “New Method for Calculation of the Load Carrying Capacity of Bevel and Hypoid Gears regarding Tooth Flank Fracture,” International Conference on Gears, Munich, Germany, pp. 173–182.
- Föppl, L., 1947, “Drang und Zwang Band III,” Leibniz-Verlag, Munich.
- Zenner, H., Richter, I., 1977, “Strength hypothesis for fatigue strength at arbitrary stress combinations,” Konstruktion, Vol. 29, No. 1, pp. 11–18.
- Dang Van, K., Griveau, B., Message, O., 1989, “On a new multiaxial fatigue limit criterion: theory and applications,” Biaxial and Multiaxial Fatigue, London: Mechanical Engineering Publications, pp. 479–496.
- Liu, J., 1991, “Contribution to the improvement of fatigue strength calculation for multiaxial loading,” Ph.D. thesis, Technical University of Clausthal.
- Oster, P., 1982, “Stresses in gears below the EHL contact,” Ph.D. thesis, Technical University of Munich.
- Witzig, J., Tobie, T., Stahl, K., 2012, “Tooth flank fracture—limit of load carrying capacity in the material depth,” FVA, Vol. 1000.
- Stiller, S., 2013, “Extension of pinion correction program (RIKOR) to determine the load distribution of spur gears,” FVA, Vol. 1077.
- Lang, O. R., 1979, “Dimensioning of complicated components made of steel,” Zeitschrift für Werkstofftechnik, Vol. 10, pp. 24–29.
- Radzevich, S. P., 2021, Dudley’s Handbook of Practical Gear Design and Manufacture, Taylor & Francis Group, Milton.
- Velten, E., 1984, “Development of a fatigue strength concept for the calculation of the fatigue strength of thermochemically edge-strengthened specimens similar to building components,” Ph.D. thesis, Technical University of Darmstadt.
- Niemann, G., Winter, H., Höhn, B.-R., Stahl, K., 2019, Maschinenelemente 1, Springer Berlin Heidelberg, Berlin, Heidelberg.
- Eberspächer, C., Höhn, B.-R., 1995, “Tooth flank durability. Investigations into non-linear damage during pitting of tooth flanks,” FVA, Vol. 457.


