Model Description
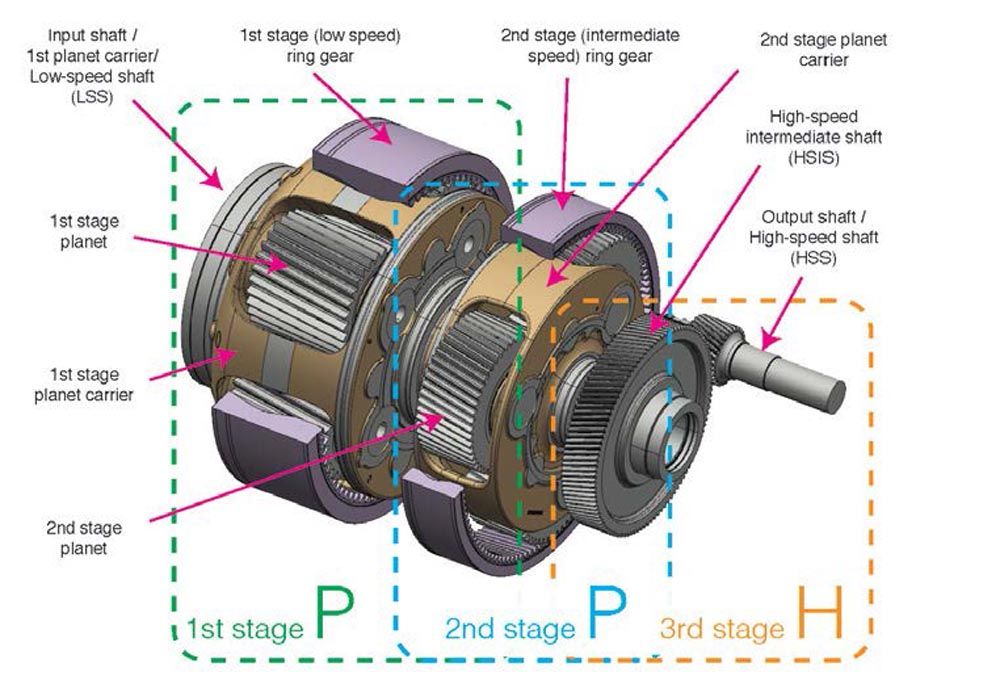
A planetary gear stage transforms the input speed according to the gear ratio, which is defined by the relation between the number of teeth of the ring gear and the sun gear, respectively. The same inverse relation applies to the load. This transmission is achieved using a complex rotative gearing system. The ring is held stationary in a typical wind turbine planetary gearbox, whereas the input torque is transmitted to the stage by the planet carrier. The planets contained by the planet carrier are the components that transfer the torque to the sun gear, which is the output of the stage.
In an ideal design, the input torque is shared evenly between the planets in the carrier. The uneven torque distribution is considered by applying the mesh load factor Kc defined in the standard AGMA 6123 (Ref. 5). The ring gear is stationary. When the flanks of the planet mesh with the ring gear, the planet rolls along the inside of the ring gear. At the same time, the planet’s opposite flanks contact the sun gear, transferring the torque to this component. All these interactions between the parts produce the gear forces at the teeth.
It is well known that the complexity of a FEM model is directly linked to the resources required by the model. These resources can be measured in terms of computational cost and time needed to prepare the model and post-process the generated data. Therefore, it is very valuable for day-to-day work to find a model that accurately represents the results in the areas under study without being excessively costly in terms of personal and computational time.
In this study, two different FEM models have been studied. The first one is a detailed model of the first planetary stage of a gearbox with a rated power of 6.x MW. In contrast, the second one is a simplified model shown in Figure 3. These models will be referred to as “high complexity” and “low complexity” models. Both models consist of the torque arm, or rotor side housing, the ring gear, the transition housing between ring gears, and the corresponding bolts and pins that complete the assembly. As shown in Figure 3, the torque arm and transition housing are symmetrical about the z-axis (vertical axis). This applies to models of both complexity levels.
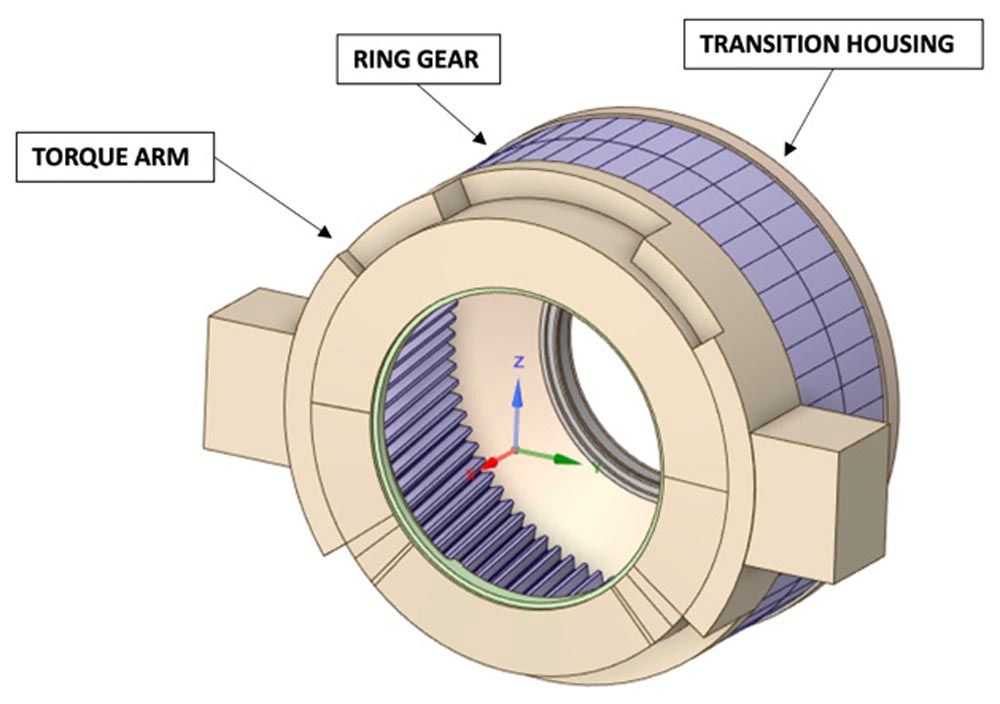 Figure 3—Simplified geometry used for the analysis.
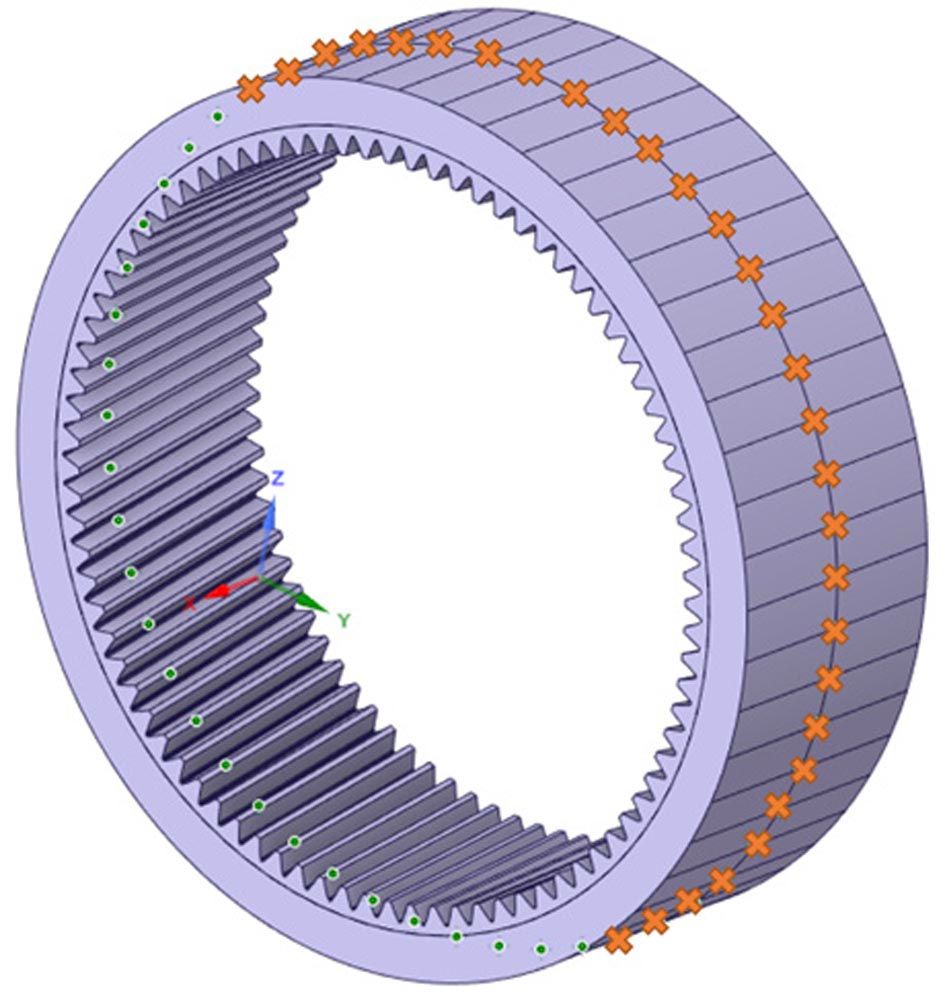 Figure 4—Strain gauges position in FEM model.
To simulate the initial conditions of the assembly, a preload has been applied to each bolt. The bolts have been represented by beam elements, which have been found suitable to model the effect of the preload and are computationally more efficient than modeling the bolts as solid bodies. The calculations have been performed in Ansys 2021 R2 software.
The forces of the model react with the torque arms, which are fixed in the Z direction, to recreate the behavior of the gearbox under working conditions. Also, the bearings’ outer rings that support the planetary stage loads have been restricted to rotating in X. Moreover, the ring of the bearing that supports the axial force generated in the gears has been limited in the axial direction. Regarding the interaction between the planets and the ring rear, a force has been applied at each tooth that, in an instant of time, is in contact with a planet, as shown in Figure 5. To do so, it has been assumed that one tooth of the ring gear fully contacts with one tooth of the planet and that the torque is evenly distributed between the planets, i.e., the mesh load factor Kc equals 1. In helical gears, the contact between the teeth develops progressively along the diagonal line of contact, and several teeth can be in contact simultaneously. Therefore, the whole length of a tooth is never wholly engaged with the mating gear. Due to the complexity of simulating the loads along the line of action of the helical gears, the forces have been simplified to be tangential to the flank of each tooth.
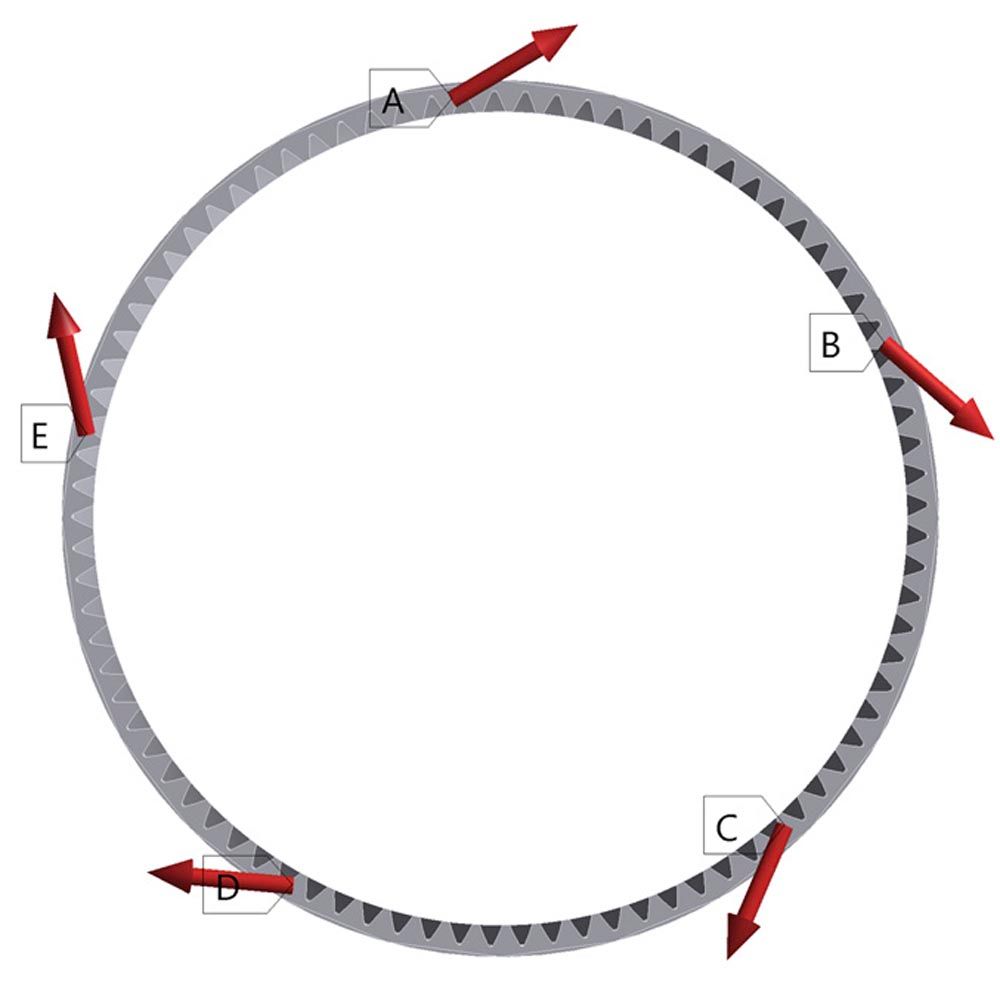 Figure 5—Applied forces in the ring gear.
The gear cycle has been defined by using several steps so that the compression-tension effects produced by the planets passing at the tooth roots are simulated. As shown in Figure 6, in the first step of the analysis, the preload was applied to the bolts. Then, in subsequent steps, the mesh force load has been applied at the corresponding flank. For example, in Step 2, the forces that simulate the loads from the planets are applied in the model, as shown in Figure 6. Then, in the following steps, the forces are moved subsequently to the flank of the tooth on the right, hence recreating the gear cycle. This process has been performed for assessments at 50 percent and 100 percent torque. Eight different angular positions have been analyzed in different steps to study the effect of the carrier’s angular positions.
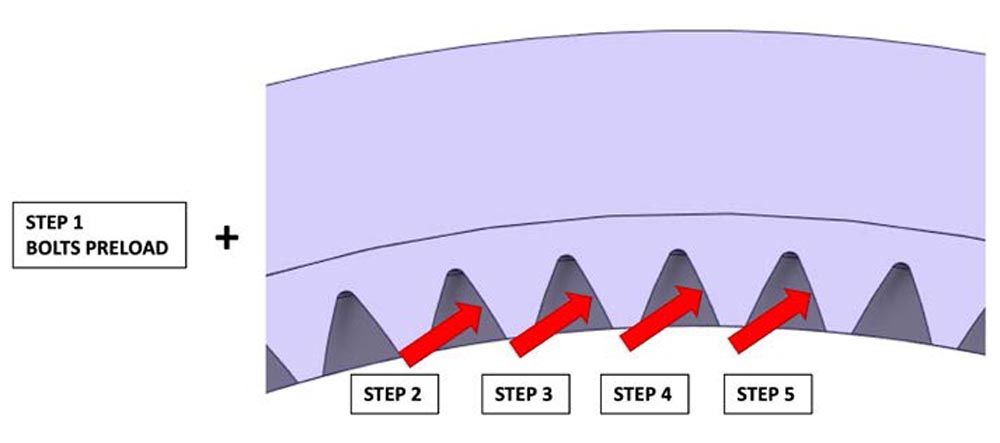 Figure 6—Applied force steps in the ring gear (local).
It is worth mentioning that to compare the results against the data obtained with the fiber-optic strain sensors, in the FEM model, a node has been positioned in the same location as each strain sensor around the ring gear (Figure 4). Hence, the deformations have been simulated and measured in the same locations.
Experimental Setup
Test Bench
A full-scale prototype gearbox, instrumented with fiber-optic strain sensors on the outer surface of the ring gear, was tested in a back-to-back test bench for up to 100 percent of its nominal torque. All tests presented in this study were performed on the back-to-back test bench shown in Figure 7, property of the company DMT GmbH & Co. KG (Ref. 6) at Krefeld (Germany), with electric motors of rated power of 7.5 MW. The position of the fiber-optic sensors can be seen on the outer surface of the first stage ring gear of “Test Gearbox 1.”
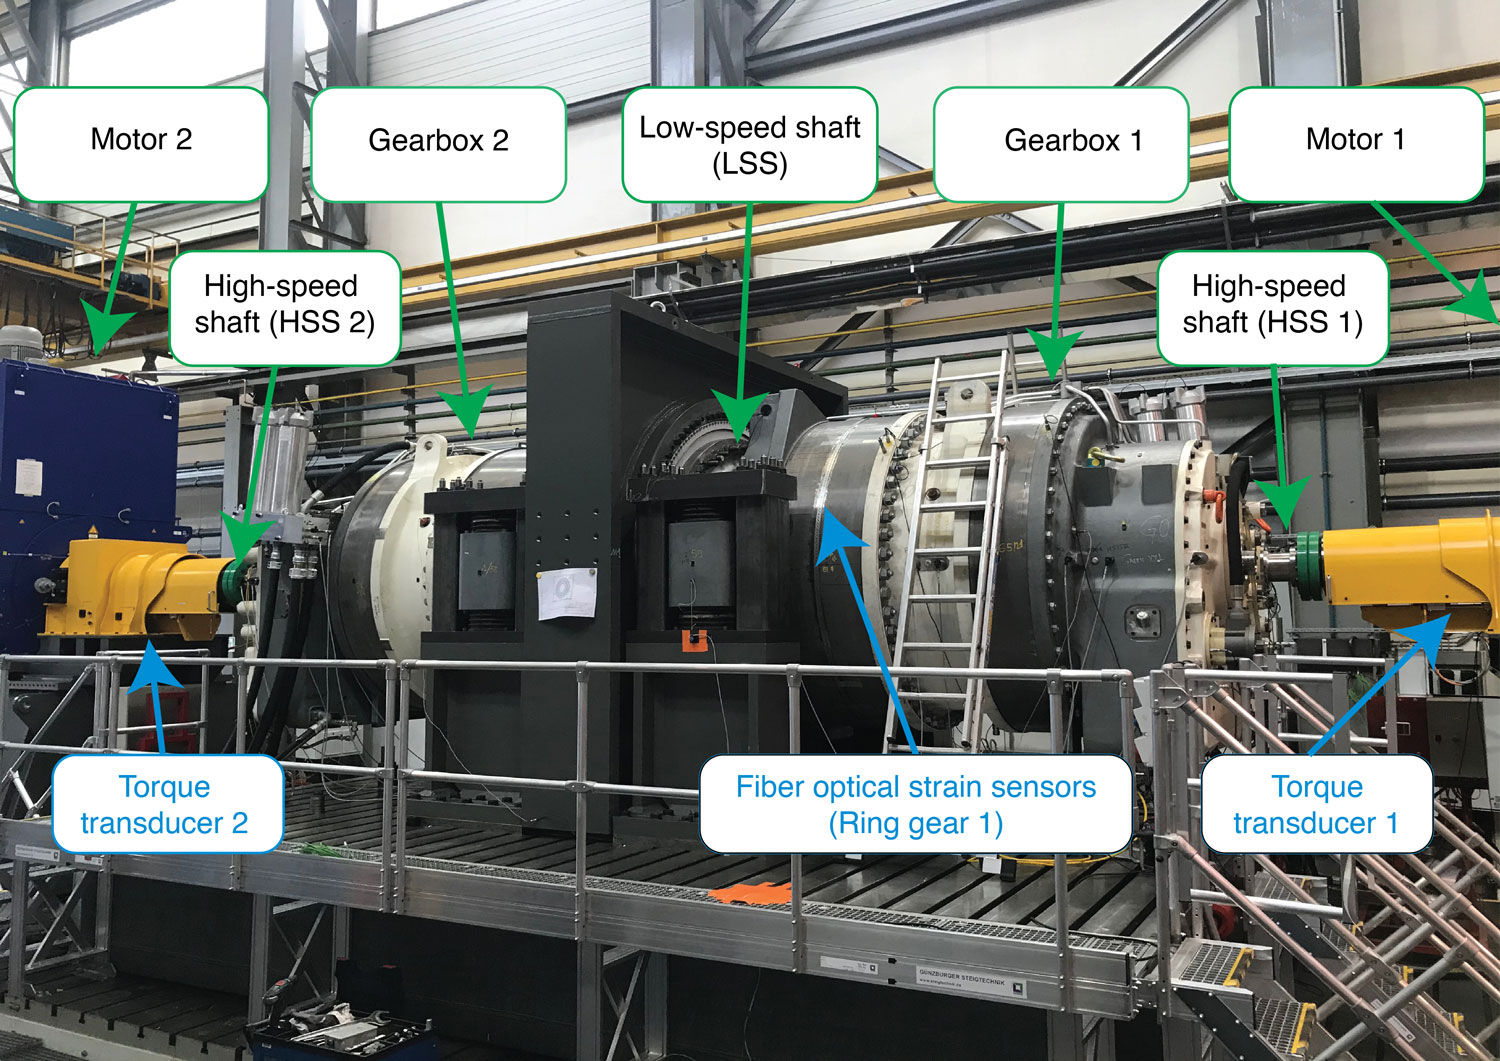 Figure 7—SGRE gearboxes on a back-to-back test bench (property of DMT GmbH & Co. KG).
Fiber-Optic Strain Sensing
A new method to measure the input torque of wind turbine gearboxes was introduced in Ref. 7. This method is based on strain measurements on the outer surface of the ring gear. The instrumentation requirements and the data logging process are simplified because the ring gear is static. Optical strain sensors based on fiber Bragg gratings (FBGs) were used because they offer a higher signal-to-noise ratio and are immune to electromagnetic interference. Since multiple strain sensors can be accommodated in a single fiber, they allow a more straightforward installation. A satisfactory correlation was found between the input torque of the carrier and the deformations on the outer surface in Ref. 7.
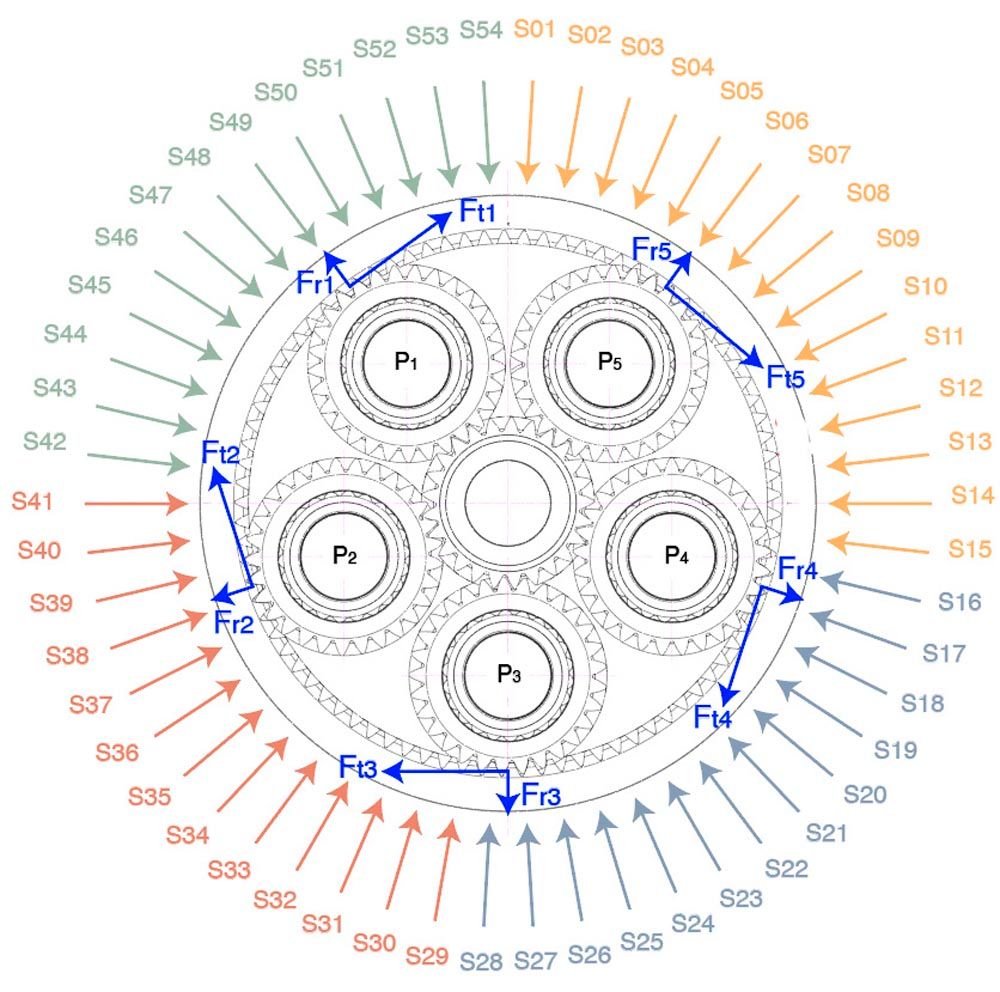 Figure 8—Location of the fiber-optic strain sensors (S01 to S54).
Four optic fibers were installed on the outer surface of the first stage ring gear, at the middle section along the width of the ring gear in the axial direction, as shown in Figure 7. The fibers were installed tangentially to the middle section, covering a complete revolution along the outer perimeter of the ring gear. Figure 8 shows the radial and angular location of all the strain sensors with the corresponding labels in a rotor side section view. The four colors of the sensor labels indicate how the FBGs belong to separate fibers (S01 to S15 in fiber number 1, S16 to S28 in fiber number 2, S29 to S41 in fiber number 3, and S42 to S54 in fiber number 4). The fiber optical sensors were supplied and installed by the company Sensing360 B.V. (Ref. 8). A more comprehensive description of the optical fiber instrumentation used can be found in Ref. 7.
Fiber Bragg gratings are sensitive to strain and temperature. The signals were detrended to remove the effect of temperature on the measured shifts in wavelengths of the FBGs. Once the long-term shift caused by temperature had been removed, the remaining signal was caused entirely by the strain imposed by the planet gear mesh events. An inductive sensor was used to provide a pulse for every full rotation of the input shaft so that the relative position of the planet carrier is known, and peak-to-peak values can be assigned to individual planets, as shown in Figure 9.
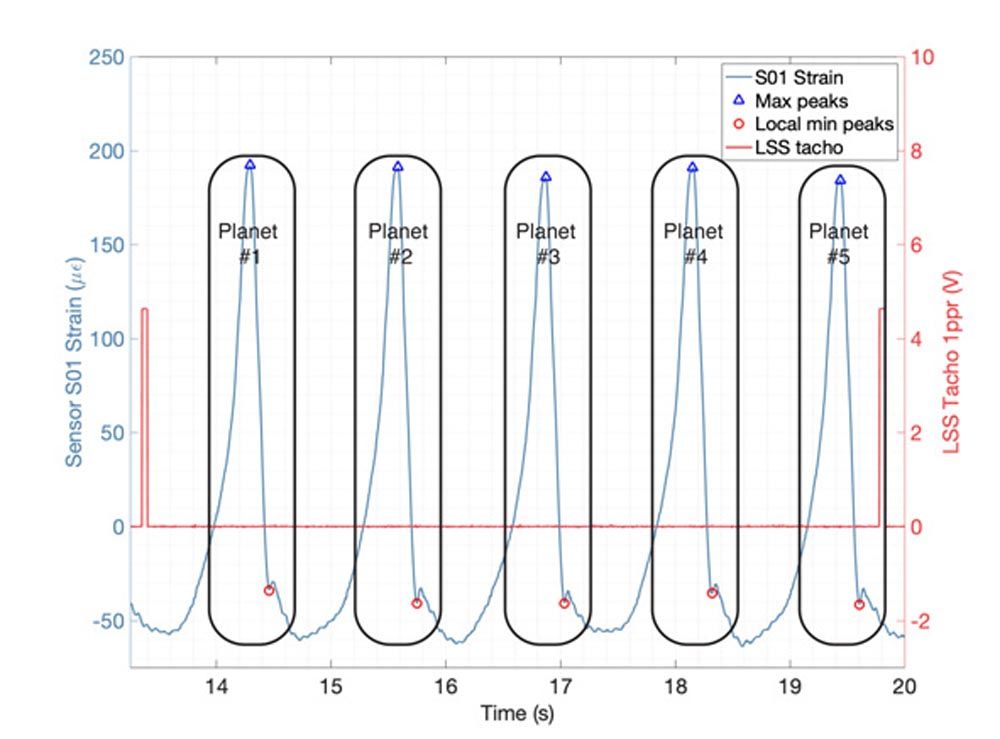 Figure 9—Sensor S01 strain signal (left axis) during a single revolution of the input shaft (right axis) with detected peaks assigned to the corresponding planet.
Nineteen short tests were performed under different stationary speed and torque conditions to characterize the relationship between strains and torque and the mesh load factor. The torque level was increased in five percent increments from 10 to 100 percent of the nominal torque. For each test, strain data was recorded for around 35 revolutions of the carrier. The gearbox rotational speed was kept constant and equal to the nominal value. A correlation between the average torque and the average peak-to-peak values of the strain sensors placed on the outer surface of the ring gear was found in Ref. 7 shown in Figure 10. Since peak-to-peak values can be assigned to individual planets, the procedure also can provide information about the load sharing between planets. Figure 11 shows the average Kc values of the five planets against torque presented in Ref. 9. The values shown by the circular markers in Figure 11 represent the mean value of all 54 sensors, and the shaded patches represent the bounds limited by the minimum and maximum Kc from all sensors.
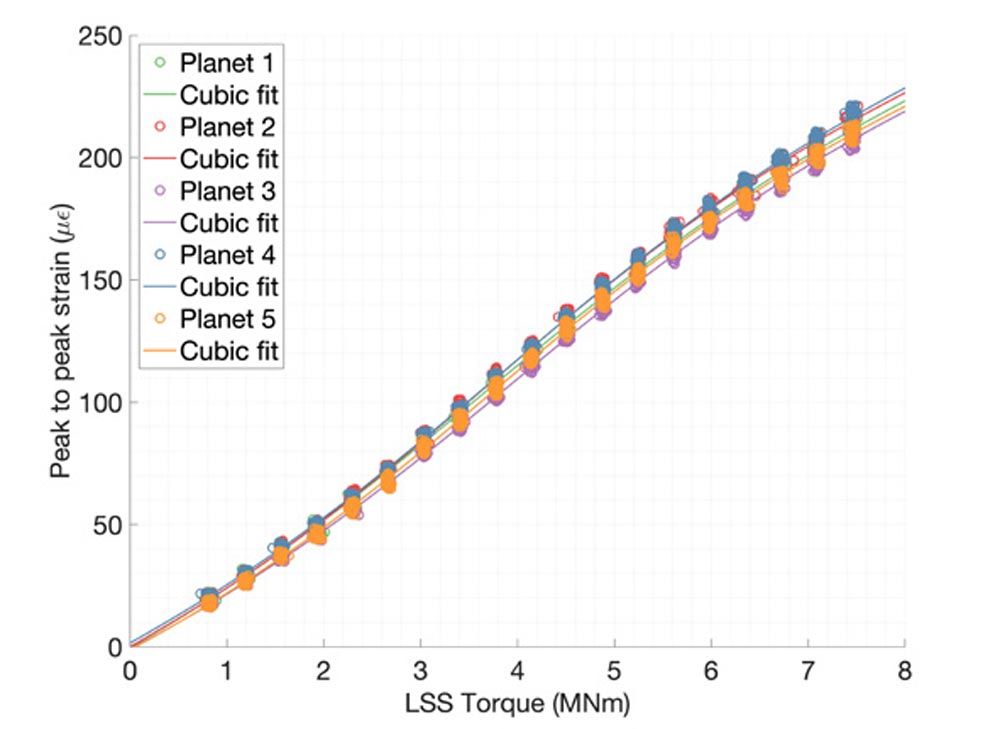 Figure 10—Peak-to-peak strain values of sensor S52 vs. torque in the low-speed shaft separated for each planet, and their corresponding cubic fit.
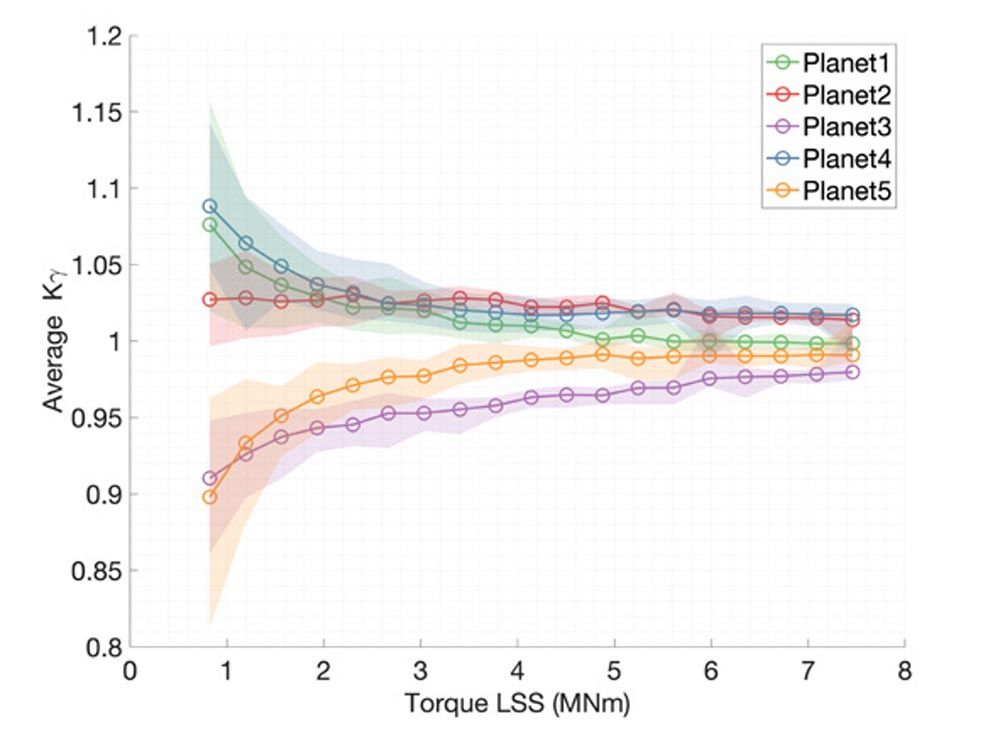 Figure 11—Kc, avg values from all fiber strain sensors. The mean value is represented by the circular marker and the shaded patch.
Results
As depicted in Figure 8, strain sensors have been positioned in the middle section of the ring gear along the external surface. A total of fifty-four sensors were installed using four fibers. The results provided by the FEM model have been compared to the experimental ones by extracting the elastic strain results at the nodes located at the same position as the strain gauges as shown in Figure 4.
The correlation of the results of the 100 percent torque load case is shown in Figure 12. Normalized strains are shown according to their angular position in the ring gear. This angular position, shown in Figure 8, is defined clockwise in the rotor side view with zero at the top vertical location. Simulation results for both high- and low-complexity models, presented in the “Model Description” section, are shown in Figure 12, denoted as “FEM High” and “FEM Low”. As can be inferred, the FEM strain results agree well with the strains measured with fiber-optical sensors. As expected, the match between simulation and sensors is less accurate for the lower complexity model. A single planet, identified as number 4 in Figure 8, yields a lower agreement between simulation and sensor strain values. Nevertheless, the average differences between FEM models and sensors were considered very satisfactory based on previous experience correlating strain measurements.
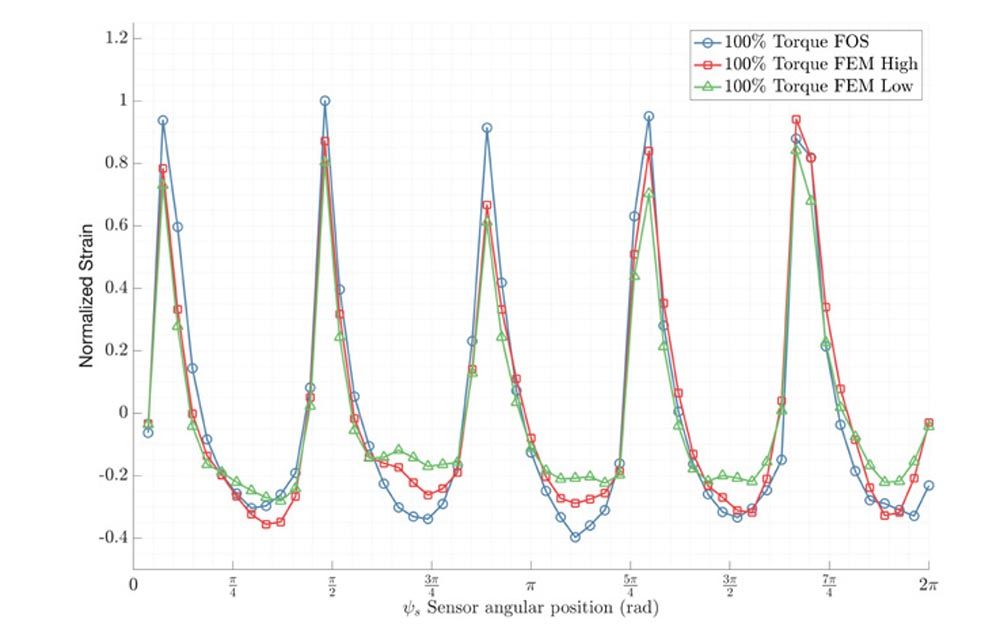 Figure 12—Fiber-optic strain sensor (FOS) measurements vs. simulation results (FEM) at 100 percent torque, “High” and “Low” represent the complexity of the model used.
Two alternative approaches have been used to quantify the accuracy of the results. First, the strains of all 54 sensors have been compared to the simulation results using the root mean square (RMS) value. This provides a picture of how well the strains are simulated for the complete revolution of the ring gear. Additionally, the accuracy of the maximum strain levels corresponding to each of the five planets has also been assessed. At 100 percent torque level, the deviation from measurements achieved by the high complexity model for step number 5 (see Figure 6) is 11.5 percent when considering the root mean square level of all 54 strains; and 12.4 percent when considering the strain maxima peaks. In comparison, for the same load step number 5 in the low complexity model, a deviation of 25.2 percent was observed using the root mean square approach and 21.4 percent when comparing the strain maxima.
The effect of the angular position of the planet carrier on the simulated strains has been studied using different steps. For each planet carrier position, four different teeth were loaded, as described in Section 2. The planet carrier was then rotated 90 degrees to study another four teeth, which accounted for eight angular positions of the planet carrier in total. This study of the angular position of the carrier was accomplished using the low-complexity model. The average accuracy obtained by all eight steps has been found to be 23.9 percent using the RMS approach and 22.9 percent for the strain maxima. Depending on the angular positions the variability observed was ±2.13 percent and ±3.85 percent respectively.
We found the correlation of the compressive stresses before and after the highest tensile strain positions is less accurate than the correlation obtained in the rest of the positions showing compressive stresses. This effect appears for both torque levels, 50 percent and 100 percent, and higher and lower complexity models. The discrepancy in the results of the positions corresponding to planet four might be because of neglecting the loads of the gearbox that come from the rest of the stages. Moreover, as has been described in Section 2, the input torque is assumed to be evenly distributed between the planets. This assumption might also be a source of discrepancy in the correlation of the results since the torque distribution between the planets is not even. The uneven distribution of torque is considered in the mesh load factor Kγ. Further investigations should be carried out considering Kc in the FEM model to obtain a more accurate correlation.
Regarding the transitions from minimum to maximum strain values, a good correlation is observed in all the positions. Hence, similar compressive-tensile behavior is described by both the FEM model and the strain gauges around the ring gear. Overall, a satisfactory agreement has been obtained between the FEM model and the results obtained by the optical strain sensors. Thus, the FEM model has been deemed reliable for obtaining accurate results and performing further investigations regarding technical aspects of the gearbox. As expected, the higher complexity model yields more accurate results. The complexity of the model must be considered thoroughly to achieve the optimum balance between accuracy and cost for the application under study.
Conclusions
We have performed an experimental evaluation of the structural finite element model of a 6MW wind turbine gearbox using fiber-optic strain sensors. Two different FEM models have been studied with different degrees of complexity. Fifty-four fiber-optic Bragg gratins were used to measure strain on the outer surface of the first stage ring gear. Tests were performed in a full-scale back-to-back gearbox test bench under different torque conditions.
A good correlation has been found between the experimental strain measurements and the results of the FEM models. The difference between simulation and strain sensors obtained using the high complexity model has been 11.5 percent when considering the root mean square level of all 54 strains and 12.4 percent when considering the strain maxima corresponding to the mesh action of each planet. These results are considered very satisfactory based on previous experience with strain measurements. The differences for the low complexity model rise to 23.9 percent and 22.9 percent respectively. As expected, the match between simulation and sensors is less accurate for the lower complexity model. Therefore, a suitable trade-off between complexity and desired accuracy is needed considering the application of structural models.
Further investigations related to mesh load factor Kγ, the loads of the gearbox that come from downstream gear stages, and different angular positions of the planet carrier(s) are suggested for future work. This is expected to yield a better correlation of the results since the uneven distribution of the transmitted was not considered in the FEM models presented in this study.
Once correlated, these structural models can be used for further investigations, such as evaluating the effect of modifying critical design parameters. For example, the effect of ring gear rim thickness of the first stage can be studied with this model. The first stage ring gear is arguably the most expensive component of a wind turbine drivetrain. Gearbox manufacturers strive to make the rim of the ring gear as thin as possible while complying with the minimum thickness requirements set by their design rules and gear rating standards. These structural models can be used to research the effect of rim thickness on the tooth root stresses, which is contemplated by the KB factor defined in the standard ISO 6336 (Ref. 10).
Increasing the confidence in structural models through experimental data allows a more optimized gearbox design, which significantly improves torque density and the overall cost of the gearbox.
Acknowledgments
We would like to sincerely acknowledge the support of Siemens Gamesa Renewable Energy and TU Delft, which made this research possible, and the collaboration with Sensing 360 B.V. and DMT GmbH & Co. KG.
References
- van Kuik, G.A.M.; Peinke, J.; Nijssen, R.; Lekou, D.; Mann, J.; Sørensen, J.N.; Ferreira, C.; van Wingerden. J.W.; Schlipf, D.; Gebraad, P.; Polinder, H.; Abrahamsen, A.; van Bussel, G.J.W.; Sørensen, J.D.; Tavner, P.; Bottasso, C.L.; Muskulus, M.; Matha, D.; Lindeboom, H.J.; Degraer, S.; Kramer, O.; Lehnhoff, S.; Sonnenschein, M.; Sørensen, P.E.; Künneke, R.W.; Morthorst, P.E.; and Skytte, K. “Long-term research challenges in wind energy—a research agenda by the European Academy of wind energy,” Wind Energy Science, Vol. 1; 1–39. https://wes.copernicus.org/articles/1/1/2016/
- ISO/IEC 61400-4:2012, Wind turbines—Part 4: Design requirements for wind turbine gearboxes. https://www.iso.org/standard/44298.html
- ANSI/AGMA 6006-B20, Standard for Design and Specifications of Gearboxes for Wind Turbines.
- Nejad A.R.; Keller, J.; Guo, Y.; Sheng, S.; Polinder, H.; Watson, S.; Dong, J.; Qin, Z.; Ebrahimi, A.; Schelenz, R; Gutiérrez Guzmán, F.; Cornel, D.; Golafshan, R.; Jacobs, G.; Blockmans, B.; Bosmans, J.; Pluymers, B.; Carroll, J.; Koukoura, S.; Hart, E.; McDonald, A.; Natarajan, A.; Torsvik, J.; Moghadam, F.K.; Daems, P.J.; Verstraeten, T.; Peeters, C.; and Helsen, J. “Wind turbine drivetrains: state-of-the-art technologies and future development trends,” Wind Energy Science, Vol. 7; 387–411. https://wes.copernicus.org/articles/7/387/2022/
- ANSI/AGMA 6123-C16, Design Manual for Enclosed Epicyclic Gear Drives.
- DMT GmbH & Co. KG, Last accessed: 30 December 2021. https://www.dmt-group.com
- Gutierrez Santiago, U.; Fernández Sisón, A.; Polinder, H.; and van Wingerden J. W. “Input torque measurements for wind turbine gearboxes using fiber optical strain sensors,” Wind Energy Science Discussions, 2021, pp. 1–28. https://wes.copernicus.org/preprints/wes-2021-69/
- Sensing 360 b.v. technology. Last accessed: 30 April 2021. https://sensing360.com
- Gutierrez Santiago, U.; Fernández Sisón, A.; Polinder, H.; and van Wingerden, J. W. “Experimental evaluation of the mesh load factor (Kγ) of a 6mW wind turbine gearbox,” J. Phys.: Conf. Ser. 2265 032003, 2022.
- ISO 6336-3:2006, Calculation of load capacity of spur and helical gears—Part 3: Calculation of tooth bending strength.


