[advertisement]
Technical Articles

April 15, 2025


Samuel Henry


Sydney Hughes


Eric Grol


Nicholas Schneider


Alexander Zoelle


Timothy Fout


Sally Homsy


Materials Gear Steels

Decarbonization of the Iron and Steel Sector: Challenges and Opportunities

With government mandates to reduce greenhouse gas (GHG) emissions, decarbonizing the largest industrial emitters has become an essential research focus. The Environmental Protection Agency (EPA) reported that industrial point sources in the United States (U.S.) emitted 1.45 billion tons of carbon dioxide (CO2) in 2022, accounting for 23 percent of all domestic CO2 emissions for that year (Refs. 1,2). One of the largest contributors to industrial emissions is the iron and steel industry, which was responsible for 2.5 percent of total U.S. GHG emissions in 2023 (Ref. 3). Due to the large quantity of emissions available for capture from this industrial sector, iron/steel production facilities present an impactful opportunity for industrial decarbonization.

Various CO2 capture technologies can be deployed in the iron/steel industry, including post-combustion capture with chemical solvents or membranes, precombustion capture with chemical solvents or membranes, and capture via calcium looping. There exist various examples of efforts to advance the decarbonization of iron/steel plants. The only operating, commercial-scale CO2 capture plant in the iron/steel industry is the Al Reyadah facility in the United Arab Emirates (Ref. 4). This plant, commissioned in 2016, was initiated as a joint venture between Abu Dhabi National Oil Company (ADNOC) and Masdar, and captures CO2 from a direct reduced iron (DRI)-based steel plant (Ref. 4). The capture plant has a nominal capacity of 800,000 tons of CO2 per year and ADNOC asserted in 2023 that the plant enabled capture of 45 percent of emissions from DRI production (Ref. 4). The approximately 89 percent pure CO2 product is dehydrated and used for enhanced oil recovery (EOR) in ADNOC’s onshore oil fields (Ref. 4). In the U.S., the U.S. Department of Energy (DOE) has sponsored front end engineering design (FEED) studies, pre-FEED studies, and pilot demonstrations examining the addition of capture to iron and steel plants. This includes a pre-FEED study led by Dastur International Inc. in coordination with Cleveland-Cliffs Inc. assessing the implementation of ION Energy’s solvent-based, post-combustion capture technology to capture 95 percent of CO2 from blast furnace (BF) flue gas from a steel plant located in Burns Harbor, IN, producing 5 million (M) tons of steel per year. A DOE-sponsored FEED study led by The University of Illinois, in partnership with Air Liquide, Visage Energy Corporation, Hatch Associates Consultants Inc., Midrex Technologies Inc., ArcelorMittal, and voestalpine Texas LLC, is examining the use of Air Liquide’s Cryocap technology to capture 95 percent of the total CO2 emissions from a Texas hot briquetted iron plant.

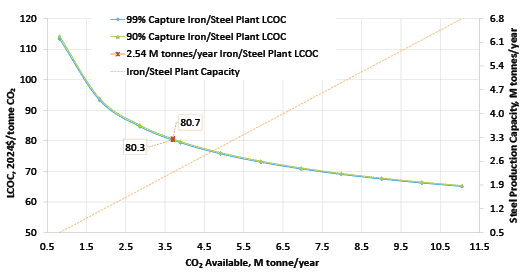
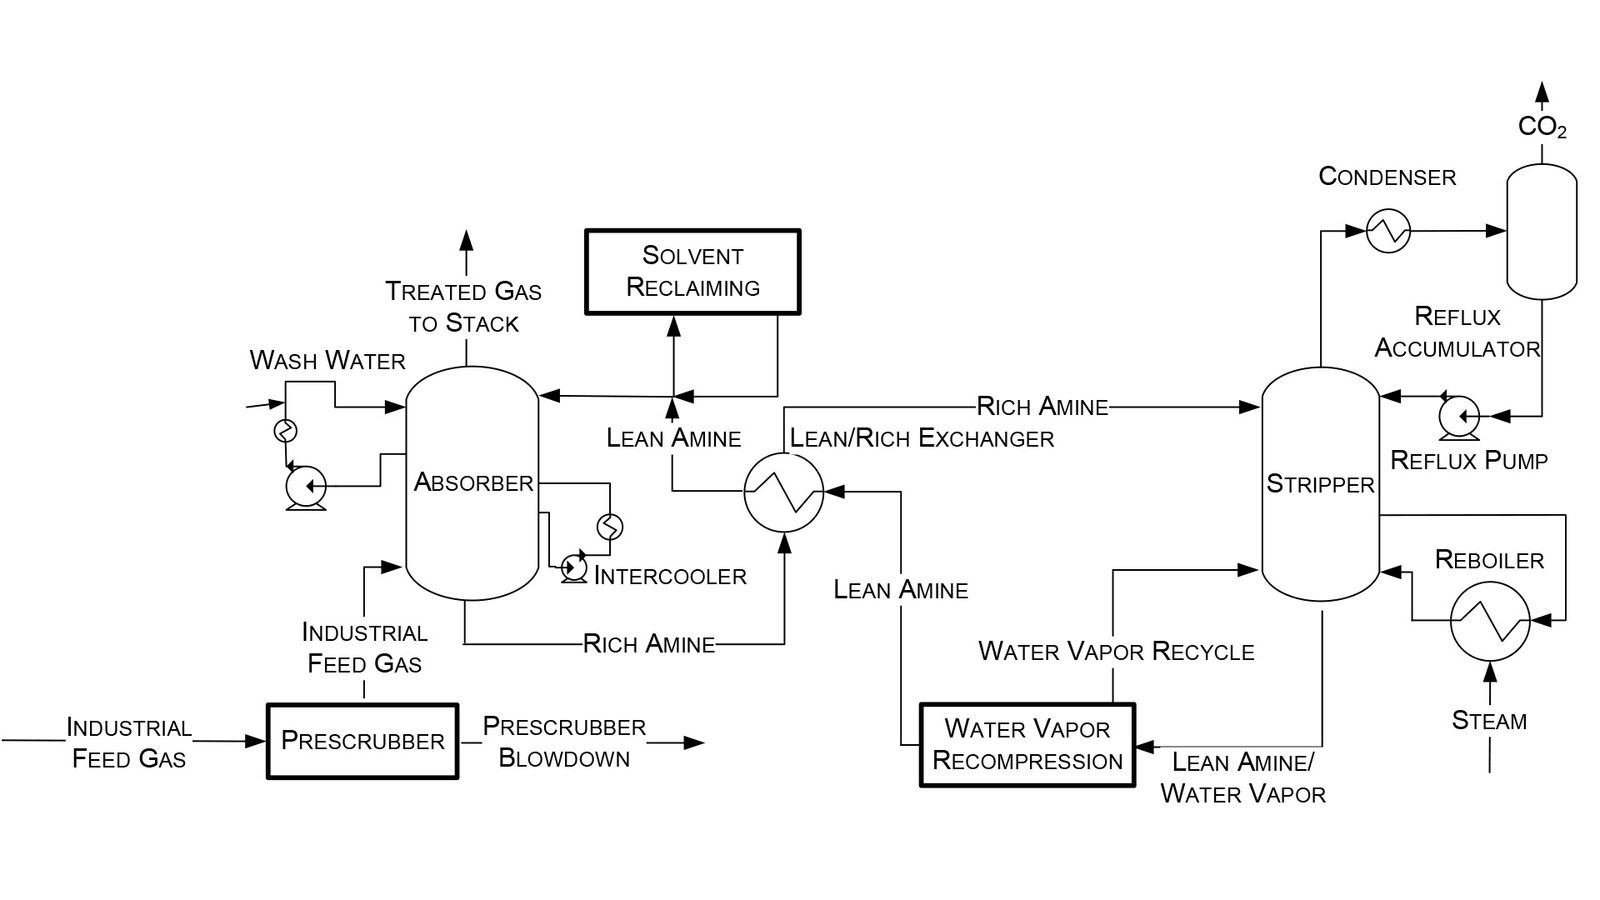
In 2023, the National Energy Technology Laboratory (NETL) released its report, “Cost of Capturing CO2 from Industrial Sources,” (Industrial Sources Report) intending to estimate the levelized cost of CO2 captured (LCOC) from selected industrial processes including iron/steel facilities (Ref. 5). A traditional pathway to produce steel from iron ore comprising a BF integrated with a basic oxygen furnace (BOF), also referred to as an integrated steel mill, is considered for this analysis. While integrated steel mills have multiple CO2 emissions sources, this work focuses on applying capture to the three largest and highest concentration sources. The capture system utilized is the CANSOLV CO2 capture technology commercially offered by Shell. CANSOLV is an amine-based, acid gas removal (AGR) process designed to recover high purity CO2 from dilute flue gas streams and is assessed at capture rates of both 90 and 99 percent. The LCOC for this system is estimated using the methodology established in NETL’s Quality Guidelines for Energy System Studies (QGESS) document, “Cost Estimation Methodology for NETL Assessments of Power Plant Performance” (Ref. 6). NETL’s 2023 Industrial Sources Report presents the LCOC in December 2018 dollars.

The current paper leverages the Industrial Sources Report’s iron/steel cases, expands the discussion, and provides the LCOC in January 2024 dollars. The financial assumptions are updated with input from NETL’s Energy Markets Analysis Team and are based on 2024 iron/steel industrial sector market data.

Background

Iron/Steel Production Methods

There are two commercial methods of iron production in operation today: the blast furnace (BF) method and direct reduced iron (DRI) method. In the BF method, coke and sintered iron are fed to the top of the BF while hot blast gas is fed through the side. Coke is oxidized to form CO2 which subsequently reacts with more coke to produce carbon monoxide (CO). This CO facilitates the reduction of iron oxides to form pig iron, a high carbon iron alloy. In 2023, the U.S. produced 20.6 M tons of pig iron and imported an additional 4.4 M tons (Ref. 7). The DRI method is a newer alternative iron production pathway. DRI is made by reducing iron ore with gas, eliminating some pre-processing steps required for BF operation (Ref. 8). Typical reductants used to make DRI are coal syngas, natural gas, or hydrogen (H2) depending on availability. In 2023, DRI production constituted 5.2 M tons of iron production in the U.S. (Ref. 7).

Steel is produced by reducing the carbon content of iron in a furnace, of which there are two types in commercial operation. Traditionally, a BOF is used to remove carbon by blowing hot oxygen through molten pig iron. A newer alternative is the electric arc furnace (EAF), which uses electricity to melt scraps and recycled steel to form a steel product. While scrap and recycled steel is considered the main feed for EAF mills, some have been configured to use feeds of pig iron or DRI (Ref. 8). As of 2023, 31.7 percent of U.S. steel was produced via EAFs, with the remainder produced via BOFs (Ref. 7).

Share and save:


This article appeared in the March/April 2025 issue.


Read PDF

[advertisement]

The traditional pathway to produce steel from the starting raw material, iron ore, is a BF integrated with a BOF, also referred to as an integrated steel mill. For these facilities, approximately 69 percent of emissions are present in the BF gas, which is often used as a heat source or a low-grade fuel for an integrated power plant (Ref. 9). Consequently, there are many different point sources for potential carbon capture in an integrated steel mill resulting in a complex challenge for decarbonization efforts. Researchers have investigated capturing CO2 from coke ovens, hot stoves, power plant stacks (PPS), and lime kiln emissions to avoid impacting the BF gas and its benefits to the plant (Ref. 10). Furthermore, much research has focused on decarbonizing BF gas without directly treating it in a CO2 capture plant. Replacing coke with biomass is one option, but only 10 percent of coke can feasibly be replaced due to an unsustainable drop in coke strength with higher replacement (Ref. 8). Another approach involves the use of H2 as an additional reducing agent to reduce the amount of coke required. One study looked at using electrolysis-derived H2 as an auxiliary reductant and found that emissions could be reduced by 21.4 percent under optimized conditions (Ref. 11). Due to its widespread commercial usage, the BF-BOF pathway was chosen for analysis in this study.

Another steel production pathway is the mini mill, in which a sole EAF is fed scrap and recycled steel (Ref. 9). Mini mills emit approximately 0.6 to 0.9 tons of CO2 per ton of steel (tons CO2/ton steel), representing a significant reduction compared to 2.2 tons CO2/ton steel for integrated steel mills (Ref. 9). However, this reduction is due to the use of scrap and recycled steel which are not available in sufficient quantities to satisfy the entire U.S. steel demand.

A new, alternative pathway being explored is the combination of DRI production with an EAF (Refs. 8,12). In a study from Argonne National Laboratory, a DRI-EAF pathway with no scrap steel feed using grid electricity and natural gas reductant showed a 14.3 percent drop in emissions and an 8.9 percent lower cost compared to BF-BOF steel (Ref. 8). The same configuration with a reductant comprising 83 percent renewable H2 and 17 percent natural gas showed a 46.6 percent reduction in CO2 emissions and a 6.6 percent greater cost as compared to BF-BOF steel (Ref. 8). Other ways to reduce emissions through the DRI pathway involve using renewable natural gas or low-carbon electricity, but these options will incur additional costs.

Size Range

According to the World Steel Association, the U.S. accounted for approximately 81.4 M tons of steel production in 2023. Of these 81.4 M tons of steel, 31.7 percent was produced using an EAF and the balance using the more traditional BOF (Ref. 7). The resulting steel product from an EAF process contains approximately 100 percent recycled steel, whereas the BOF product contains 25 percent recycled steel on average (Ref. 7). The utilization of scrap steel results in lower CO2 emissions for an EAF process (0.6–0.9 tons CO2/ton steel) versus the BOF process (2.2 tons CO2/ton steel) (Ref. 9). The combination of generally smaller EAF plants and lower concentration of EAF plant CO2 emissions projects to a higher LCOC from an EAF process. Therefore, this study focuses on CO2 capture from BOF process steel plants. Furthermore, as no new BOF steel plants are expected to be constructed in the U.S. in the near term, only retrofit application of CO2 capture is considered. The total production capacity, as given by the World Steel Association for BOF plants in the United States in 2023, was 55.6 M tons (Ref. 7).

Methodology

CO2 Point Sources

A study by Wiley, et al., published in 2010, assessed the opportunities for CO2 capture in Australian iron and steel mills (Ref. 9). This study utilized stream data from an Australian BOF steel mill, and within the base plant, the largest source of CO2 comes from the top gas of the BF as is typical in an integrated steel mill; however, this stream is not directly vented. Instead, the BF gas is cleaned and used in the plant as low-grade fuel, and rather than having a high-content CO2 point source from the subfurnace gas, the CO2 is distributed throughout the plant as smaller CO2 point sources. The resulting CO2 point sources available to be captured include the PPS, coke oven gas (COG), BF stove (BFS), sinter stack, blown oxygen steelmaking stack, hot strip mill stack, plate mill stack, and lime kiln, based on the configuration detailed by Wiley, et al. (Ref. 9). The three highest CO2 concentrations of these point sources are the COG at 27 volume percent, the BFS at 21 volume percent, and the PPS at 23 volume percent. These three point sources are evaluated in this analysis, and their characteristics are described in Table 1.

DescriptionPPSCOGBFS
CO2 Emitted/Tonne Steel produced0.740.350.39
Pressure (psia)14.714.714.7
Temperature (°F)572212572

Composition (vol %)

Nitrogen (N2)67.067.068.0
Water (H2O)8.05.010.0
CO223.027.021.0
O21.01.01.0
Table 1—BOF iron and steel plant characteristics (Ref. 9).

Personal communication with a former U.S. Steel Braddock, PA, facility employee indicated that while the coke ovens are approximately five miles from the BF, the COG is circulated back to the BF to preheat the incoming air. Therefore, these two streams are located relatively close to one another and may be combined. As such, this analysis assumes two CO2 capture units with two corresponding compression trains. Figure 1 is a simplified block flow diagram (BFD) of the Braddock steel mill.

Figure 1—Braddock steel mill plot plan.

Design Input and Assumptions

The following is a list of design inputs and assumptions specific to the iron/steel process that were made for the purpose of this study:

  • The representative BOF integrated steel mill has a production capacity of 2.54 M tonnes/year.
  • The CO2 generated is 3,738,928 tons CO2/year at 100 percent capacity factor (CF).
  • There are three high purity sources: COG, BFS, and COG PPS. The COG and BFS are combined into one stream due to plot plan and total 1,864,388 tons CO2/year (at 100 percent CF); COG PPS utilizes its own separation and compression facility and generates 1,874,540 tons CO2/year (at 100 percent CF).
  • Since there are two separate capture systems, 4.6 operators are considered (i.e., 2.3 operators per capture system).
  • As a low purity source, separation, compression, and cooling are required. Separation is accomplished using Shell’s CANSOLV solvent-based CO2 capture system.
  • CO2 capture rates of 90 and 99 percent are evaluated.
  • The CO2 quality is based on the EOR pipeline standard as mentioned in NETL’s QGESS for CO2 Impurity Design Parameters (Ref. 13).

CO2 Capture System

The AGR system utilized is the CANSOLV CO2 capture technology commercially offered by Shell. This amine-based, post-combustion process is designed to recover high purity CO2 from dilute streams that contain O2, such as flue gas from coal-fired power plants, combustion turbine exhaust gas, and other industrial waste streams. The AGR unit also provides polishing of residual sulfur components in the CO2 capture stream. A dedicated natural gas-fired boiler is also included to generate the steam required for the capture system, but the flue gas from the boiler is not routed to the CO2 capture system. The performance and cost information for the AGR units employed herein are based on data provided by Shell in 2021. The CO2 removal efficiency of the AGR unit is represented at two rates, 90 and 99 percent for each case. A typical flowsheet for the process is shown in Figure 2.

Figure 2—Shell’s CANSOLV CO2 capture system typical process flow diagram.

Centrifugal Compressor

Compression of the CO2 product is required for pipeline transportation and storage or use. As such, integrally geared centrifugal compression trains (8 stages each) are included with each CO2 product stream. All compressors discharge at a pressure of 2,214.7 psia (2,200 psig). This is the pipeline pressure specification as stated in NETL’s QGESS for CO2 Impurity Design Parameters (Ref. 13). However, it should be noted that pressure requirements can vary by location, and pressures as low as 1,200 may be acceptable (Ref. 14). A quote provided for the development of NETL’s “Cost and Performance Baseline for Fossil Energy Plants Volume 1: Bituminous Coal and Natural Gas to Electricity,” Revision 4, was utilized to represent the cost for this equipment (Ref. 15).

Cost Estimation Methodology and Financial Assumptions

[advertisement]

To the extent possible, cost results for this analysis are estimated using the methodology established in NETL’s Quality Guidelines for Energy System Studies (QGESS) document, “Cost Estimation Methodology for NETL Assessments of Power Plant Performance” (Ref. 6). Detailed information about topics such as contracting strategy; engineering, procurement, and construction (EPC) contractor services; estimation of capital cost contingencies; owner’s costs; cost estimate scope; economic assumptions; and finance structures are available in this document. The financial assumptions employed were developed by NETL’s Energy Markets Analysis Team in 2024 based on market data reflective of the iron/steel industrial sector.

Levelized Cost of CO2 Captured

The LCOC as defined by Equation 1, considers the equipment required for CO2 removal and compression, as well as the balance of plant equipment, operation and maintenance, purchased power, and fuel costs:

(1)

Where TOC is the total overnight costs of CO2 capture equipment, CCF is the capital charge factor, FOM is the annual fixed operation and maintenance (O&M) costs, VOM—is the annual variable O&M costs, PSG is power and steam generation (natural gas purchase) costs, and CF is the capacity factor (85 percent assumed).

Results and Discussion

Block Flow Diagrams and Stream Tables

For the COG/BFS case, the COG stream and BFS stream are mixed and sent to the CO2 capture system. Water and solids recovered from the capture system are sent to waste treatment. The CO2 stream is then compressed with interstage cooling and after-cooled before reaching the EOR pipeline. Figure 3 shows the BFD for this process, and Table 2 and Table 3 show the stream table for this process with 99 percent and 90 percent capture, respectively.

Figure 3—CO2 capture BFD for COG/BFS.
 1234567
V-L Mole Fraction       
CO20.27000.21000.23450.98790.99950.99950.0034
H2O0.05000.10000.07950.01210.00050.00050.0237
N20.67000.68000.67590.00000.00000.00000.9588
O20.01000.01000.01000.00000.00000.00000.0141
Total1.00001.00001.00001.00001.00001.00001.0000
V-L Flowrate (kgmol/hr)8,44312,17320,6164,8454,7884,78814,533
V-L Flowrate (kg/hr)269,106370,224639,331211,692210,637210,637405,309
Temperature (°C)10030021931803038
Pressure (MPa, abs)0.100.10.10.215.315.30.1
Steam Table Enthalpy (kJ/kg)3,7003,5933,6388,7938,7588,755309.0
Aspen Plus Enthalpy (kJ/kg)-3,638-3,217-3,394-8,961-9,042-9,195-240.1
Density (kg/m3)1.00.60.83.5432.5630.11.1
V-L Molecular Weight31.930.431.043.744.044.027.9
Table 2—Iron/steel COG/BFS stream table with 99 percent capture.
 1234567
V-L Mole Fraction       
CO20.27000.21000.23460.98810.99950.99950.0322
H2O0.05000.10000.07950.01190.00050.00050.0237
N20.67000.68000.67590.00000.00000.00000.9303
O20.01000.01000.01000.00000.00000.00000.0137
Total1.00001.00001.00001.00001.00001.00001.0000
V-L Flowrate (kgmol/hr)8,44312,17320,6164,4054,3544,35414,978
V-L Flowrate (kg/hr)269,106370,224639,331192,516191,573191,573424,582
Temperature (°C)10030021931803038
Pressure (MPa, abs)0.100.10.10.215.315.30.1
Steam Table Enthalpy (kJ/kg)3,7003,5933,6388,7938,7588,755691.0
Aspen Plus Enthalpy (kJ/kg)-3,638-3,217-3,394-8,960-9,042-9,195-636.8
Density (kg/m3)1.00.60.83.5432.5630.11.1
V-L Molecular Weight31.930.431.043.744.044.028.3
Table 3—Iron/steel COG/BFS stream table with 90 percent capture.

In the same manner, the COG PPS stream is sent to the CANSOLV CO2 capture system. Water and solids recovered from the capture process are sent to waste treatment. The CO2 stream is then compressed with interstage cooling and after-cooled before reaching the EOR pipeline. Figure 4 shows the BFD for this process, and Table 4 and Table 5 show the stream table for this process with 99 percent and 90 percent capture, respectively.

Figure 4—CO2 capture BFD for COG PPS.
 12345
V-L Mole Fraction     
CO20.27000.21000.23450.98790.9995
H2O0.05000.10000.07950.01210.0005
N20.67000.68000.67590.00000.0000
O20.01000.01000.01000.00000.0000
Total1.00001.00001.00001.00001.0000
V-L Flowrate (kgmol/hr)8,44312,17320,6164,8454,788
V-L Flowrate (kg/hr)269,106370,224639,331211,692210,637
Temperature (°C)1003002193180
Pressure (MPa, abs)0.100.10.10.215.3
Steam Table Enthalpy (kJ/kg)3,7003,5933,6388,7938,758
Aspen Plus Enthalpy (kJ/kg)-3,638-3,217-3,394-8,961-9,042
Density (kg/m3)1.00.60.83.5432.5
V-L Molecular Weight31.930.431.043.744.0
Table 4—Iron/steel COG PPS stream table with 99 percent capture.
 12345
V-L Mole Fraction     
CO20.27000.21000.23450.98790.9995
H2O0.05000.10000.07950.01210.0005
N20.67000.68000.67590.00000.0000
O20.01000.01000.01000.00000.0000
Total1.00001.00001.00001.00001.0000
V-L Flowrate (kgmol/hr)8,44312,17320,6164,8454,788
V-L Flowrate (kg/hr)269,106370,224639,331211,692210,637
Temperature (°C)1003002193180
Pressure (MPa, abs)0.100.10.10.215.3
Steam Table Enthalpy (kJ/kg)3,7003,5933,6388,7938,758
Aspen Plus Enthalpy (kJ/kg)-3,638-3,217-3,394-8,961-9,042
Density (kg/m3)1.00.60.83.5432.5
V-L Molecular Weight31.930.431.043.744.0
Table 5—Iron/steel COG PPS stream table with 90 percent capture.

Performance Summary

The performance summary for both 90 and 99 percent capture cases in the COG/BFS section of the steel mill is provided in Table 6, while that of the COG PPS section is shown in Table 7.

Item2.54 M tonne steel/year with 90 percent CO2 capture (kWe)2.54 M tonne steel/year with 99 percent CO2 capture (kWe)
CO2 Capture Auxiliaries4,8005,400
Steam Boiler Auxiliaries510560
CO2 Compressor14,66016,120
Circulating Water Pumps1,4801,610
Cooling Tower Fans770830
Total Auxiliary Load22,22024,520
Table 6—Performance summary for iron/steel COG/BFS section.
Item2.54 M tonne steel/year with 90 percent CO2 capture (kWe)2.54 M tonne steel/year with 99 percent CO2 capture (kWe)
CO2 Capture Auxiliaries4,9005,400
Steam Boiler Auxiliaries520570
CO2 Compressor14,75016,210
Circulating Water Pumps1,4901,620
Cooling Tower Fans770830
Total Auxiliary Load22,43024,630
Table 7—Performance summary for iron/steel COG PPS section.

Cost Results

The cost results for CO2 capture retrofit in an integrated steel mill are presented in this section. The LCOC for the total capture system at both 99 and 90 percent capture in January 2024 real dollars is presented in Figure 5. LCOC is broken down into its components: capital, fixed O&M, variable O&M, and purchased power and fuel. Figure 6 presents the sensitivity of LCOC to steel plant scale. For comparison, Figure 7 provides insight into the decarbonization potential of applying capture to different industries and the cost associated with the different applications.

Figure 5—LCOC for 2.54 M tons/year iron/steel retrofit cases.
Figure 6—LCOC sensitivity to iron/steel retrofit scale.
Figure 7—LCOC and decarbonization potential of applying capture at different industrial applications.

Conclusions

Two CO2 capture and compression systems for a 2.54 M tons/year integrated steel mill were modeled to estimate the LCOC from the COG and BFS combined flue gas stream and from the COG PPS exhaust. The results showed the LCOC of CO2 to be $80.3/ton CO2 and $80.7/ton CO2 for a retrofit site with 99 and 90 percent capture, respectively. While the LCOC for retrofitting iron/steel mills is higher compared to other point sources evaluated in the Industrial Sources Report, mainly due to the relatively lower purity CO2 available, the quantity of CO2 to be captured from such a process makes adding capture to iron/steel plants attractive as it would represent a significant GHG reduction.

Acknowledgements

This work was funded by the U.S. Department of Energy’s Office Fossil Energy and Carbon Management through National Energy Technology Laboratory’s ongoing research under the Point Source Capture Multi Year Research Plan.

Disclaimer

This project was funded by the United States Department of Energy, National Energy Technology Laboratory an agency of the United States Government, through a support contract. Neither the United States Government nor any agency thereof, nor any of its employees, nor the support contractor, nor any of their employees, makes any warranty, express or implied, or assumes any legal liability or responsibility for the accuracy, completeness, or usefulness of any information, apparatus, product, or process disclosed, or represents that its use would not infringe privately owned rights. Reference herein to any specific commercial product, process, or service by trade name, trademark, manufacturer, or otherwise does not necessarily constitute or imply its endorsement, recommendation, or favoring by the United States Government or any agency thereof. The views and opinions of authors expressed herein do not necessarily state or reflect those of the United States Government or any agency thereof.

References

  1. EPA, “Greenhouse Gas Inventory Data Explorer,” 2023. [Online]. Available: https://cfpub.epa.gov/ghgdata/inventoryexplorer/ [Accessed 9 December 2024].
  2. EPA, “Sources of Greenhouse Gas Emissions,” 2019. [Online]. Available: https://www.epa.gov/ghgemissions/sources-greenhouse-gas-emissions [Accessed 19 September 2024].
  3. EPA, “Facility Level Information on Greenhouse Gases Tool,” 2020. [Online]. Available: https://ghgdata.epa.gov/ghgp/main.do?site_preference=normal [Accessed 9 December 2024].
  4. S. Nicholas and S. Basirat, “Carbon Capture for Steel?,” Institute for Energy Economics and Financial Analysis, 2024.
  5. NETL, “Cost of Capturing CO2 from Industrial Sources,” U.S. Department of Energy, Pittsburgh, 2023.
  6. NETL, “Quality Guidelines for Energy System Studies: Cost Estimation Methodology for NETL Assessments of Power Plant Performance,” U.S. Department of Energy, Pittsburgh, 2019.
  7. World Steel Association, “World Steel in Figures,” 2024. [Online]. Available: https://worldsteel.org/data/world-steel-in-figures-2024/ [Accessed 19 November 2024].
  8. G. Zang, P. Sun, A. Elgowainy, P. Bobba, C. McMillan, O. Ma, K. Podkaminer, N. Rustagi, M. Melaina and M. Koleva, “Cost and Life Cycle Analysis for Deep CO2 Emissions Reduction for Steel Making: Direct Reduced Iron Technologies,” Steel Research International, Vol. 94, No. 6, 2023.
  9. D. Wiley, M. Ho and A. Bustamante, “Assessment of opportunities for CO2 capture at iron and steel mills: An Australian perspective,” Energy Procedia, Vol. 4, pp. 2654-2661, 2011.
  10. J. Perpiñán, P. B. M. Begoña, V. Eveloy, P. Kanna, A. Raj, P. Lisbona and L. Romeo, “Integration of carbon capture technologies in blast furnace based steel making: A comprehensive and systematic review,” Fuel, Vol. 336, 2023.
  11. NETL, “Enabling Production of Low Carbon Emissions Steel through CO2 Capture from Blast Furnace Gases,” NETL, 2023. [Online]. Available: https://www.netl.doe.gov/project-information?p=FE0031937 [Accessed 20 November 2024].
  12. NETL, “Industrial Carbon Capture from an Existing Hot Briquetted Iron Manufacturing Facility using the Cryocap FG Technology,” NETL, 2023. [Online]. Available: https://www.netl.doe.gov/project-information?p=FE0032221 [Accessed 20 November 2024].
  13. NETL, “Quality Guidelines for Energy System Studies: CO2 Impurity Design Parameters,” DOE/NETL-PUB-22529, Pittsburgh, 2019.
  14. NETL, “Carbon Dioxide Enhanced Oil Recovery: Untapped Domestic Energy Supply and Long Term Carbon Storage Solution,” U.S. DOE/NETL, Pittsburgh, 2010.
  15. NETL, “Cost and Performance Baseline for Fossil Energy Plants Volume 1: Bituminous Coal and Natural Gas to Electricity Revision 4,” DOE, Pittsburgh, 2019.
  16. AACE International, Cost Estimate Classification System—As Applied in Engineering, Procurement, and Construction for the Process Industries; TCM Framework 7.3—Cost Estimating and Budgeting, AACE International, 2005.
This paper was first presented at the 17th International Conference on Greenhouse Gas Control Technologies, GHGT-17, 20th–24th October 2024 Calgary, Canada. Available at SSRN: ssrn.com/abstract=5070025 or dx.doi.org/10.2139/ssrn.5070025
[advertisement]