Experimental and Analytical Study of the Effect of Shot Peening on Gear Micropitting and Contact Fatigue Failure
Micropitting damage is one of the failure modes commonly observed on case-hardened gears and is caused by cyclic stresses and plastic flow on the asperity scale (Ref. 1). The micropitting degrades progressively the geometries of the contact surfaces which can result in the fatigue failure in the form of macropitting (Ref. 2).
Shot peening is a cold working process in which the surface of a part is bombarded with small spherical media called shot. Each shot striking the material acts as a tiny peening hammer, imparting to the surface a small indentation or dimple which results in a thin layer of high-magnitude residual compressive stress at the surface (Ref. 3).
The shot peening is not a substitute for heat treatment, but an additional and useful process to increase fatigue life. Various investigations were performed in several research projects about the influence of shot peening on the load-carrying capacity of gears. It was found that shot peening increases the bending fatigue strength as well as the pitting load-carrying capacity (Refs. 4–8). The literature provides information on the micropitting phenomenon: description, morphology, appearance, etc., but it gives very little information on the relationship between shot peening and the appearance of micropitting. Nevertheless, what is clear is the important role played by surface roughness.
The shot peening process often leads to increased surface roughness values, so combining shot peening and superfinishing increases the load-carrying capacity of gears against micropitting and macropitting (Refs. 9, 10). Superfinishing involves an additional cost and sometimes it is not an economical solution for the industries.
A previous study (Ref. 11) aims to use shot peening to increase the resistance to micropitting by optimizing the surface topography without operation post shot peening. This study allowed the identification of a particular type of shot peening (conventional shot peening) leading to surface topography and roughness parameters optimization resulting in a delay of the micropitting apparition. However, this solution has been validated on rollers and through fatigue tests on a twin disc bench.
This study aims to investigate the effect of this identified type of shot peening on the micropitting resistance of the gear tooth flanks and the macropitting resistance and to compare the experimental results with the calculation results based on standard methods (ISO/TS 6336-22:2018 [Ref. 12] for micropitting and ISO 6336: 2019 [Ref. 13] and AGMA 2101-D04 [Ref. 14] for pitting).
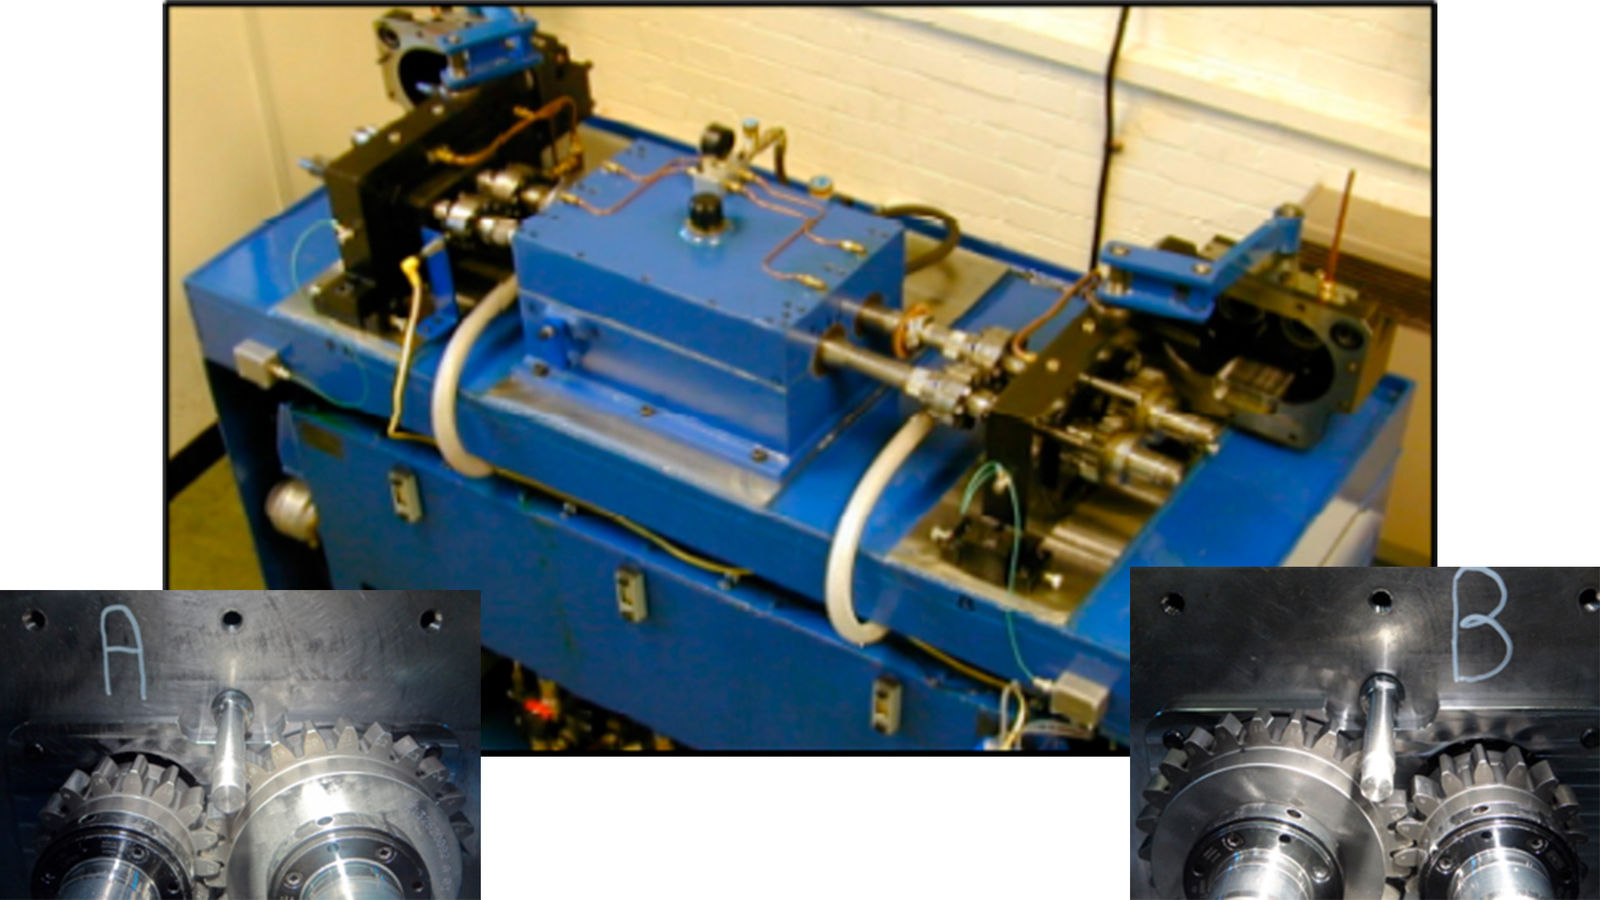
To study the sensitivity of gear surfaces to micropitting, contact fatigue tests were carried out on the back-to-back test rig (Figure 1) developed by Design Unit. This is a gear test rig in an initially closed mechanical loop. This test rig allows two identical gears to be tested simultaneously under the same loading conditions.
Figure 1—Back-to-back test rig (91.5 mm center distance).
Gear Specimens
Table 1 below summarizes the macrogeometric characteristics of the test gear teeth. It should be noted that this is the most studied gear geometry in the literature on gear contact fatigue using this type of test rig.
[advertisement]
Microgeometric modifications (profile and flank line modifications) are introduced at the teeth of the studied gear to get as close as possible to the definition conditions of industrial gears. Table 2 below summarizes the microgeometric characteristics of the gear teeth used in the tests.
It should be noted that the geometric and loading data are based on the two reference documents which describe tests to be conducted on an FZG type test rig (Refs. 16, 17).
The table below includes the main operation data of the gear.
Materials and Surface Finishing
A summary of the specimens used in this study, their manufacturing process and surface treatments are described below:
Reference gear (REF): Case-hardened + quenched; the specimens are cut and then heat treated. After heat treatment, the gears are ground to remove any irregularities that may have occurred during heat treatment.
Shot peened gear (SP): Case-hardened + quenched + shot peened; the specimens were first cut and ground. The tooth surfaces were then shot peened to create compressive residual stresses across the surface.
The mechanical characteristics of materials are as follows.
Figure 3—Roughness comparison.
Figure 4—Definition of roughness profile parameters: Kurtosis (Rku) and Skewness (Rsk).
Shot Peening
The gears were shot peened using a nozzle device. The shot peening conditions are as follows: G2: UFS100, Pressure 6 bars, 200 percent, angle 30 degrees (single shot—200 percent coverage).
The measurement of residual stresses in test specimens was carried out using an X-ray diffractometer.
Figure 2 shows that shot peening increases the residual stresses in the surface layer to a depth of about 40µm. The residual stress profile of the nonpeened teeth shows a very high stress gradient on the surface (-600MPa to -250MPa over a depth of 10µm) characteristic of the grinding operation.
The surface roughness of the flanks of the test gear teeth was measured before testing. The measurements were made on 3 teeth of each gear and on the two flanks of each tooth. The roughness was characterized by white light interferometry using a Bruker noncontact 3D surface roughness machine. The measurement results show that Rsk and Rku have the same orders of magnitude while Ra, Rq, Pc and Rz have lower values on the shot-peened gears (see Figure 3).
We have to remember that Rku describes the peaks shape, and Rsk the presence of peaks or valleys. Based on the diagram in Figure 4, the configuration Rku 3 and Rsk 0 gives logically a surface topography that is unfavorable to the appearance of micropitting. Pc is the mean height of the primary profile element.
Test Results
All pinion and wheel teeth are numbered to allow clear identification of damage locations. The test cycle includes stop phases to follow the evolution of the degradation of the active flanks. At each stop, photos of the flanks are taken. The criteria to finish the test is generalized macropitting damage of the active flanks. Photographs of the gear tooth flanks are taken, showing the initial state and after the different loading cycles, enabling observation of the evolution of the damage on the flanks. An example of the results is shown in Figure 5.
For all the tests carried out on the shot-peened gears (SP) and the nonpeened (REF), the micropitting damage on the flanks is initiated in the dedendum zone where the sliding conditions are the most severe.
The observation of the images of the surfaces thus obtained makes it possible to highlight the following points:
The micropitting started in the dedendum zone below the pitch diameter of the reference flanks (unpeened) and shot peened (SP) flanks after the same test time or earlier. The micropitting covers a large part of the tooth dedendum on shot-peened flanks.
The presence of micropitting around the pitch line of the pinion is also noted, which may have been caused by stress concentration in this area. The occurrence of micropitting is not usual in this area, it is often observed in the tooth dedendum. Similar results have already been obtained in other research from the literature (Ref. 17).
For comparable test durations, the micropitting area on the shot-peened flanks (SP) is greater than that on the nonpeened flanks (REF).
A difference in the evolution of the micropitting on teeth between REF and SP flanks. Micropitting on REF flanks is progressive.
The tests carried out on gears were conducted until the appearance of Macropitting/spalling on the teeth flanks.
The appearance of spalling on the REF gears was observed after about 8.85×10⁶ cycles of loading (66 hours on average) whereas on the SP gears, macropitting was observed on the pinion after about 28.2×10⁶ (209 hours), the test was conducted up to 32.26×10⁶ (239 hours) but no widespread macropitting / spalling on the flanks was observed.
Analytical Study
Several international standards have been developed to guide the design of gears to ensure sufficient load capacity to prevent their failure. These methods are developed by many international and national committees such as ISO, AGMA, and DIN, to guide the different aspects of gear design. In this section, we present a brief review of standard methods for calculating the load capacity of gears concerning macropitting and micropitting, then the calculation results based on these methods are presented and compared with the experimental results presented previously. This calculation is performed using the KISSsoft 2022 software package.
Review of Gear Load-Capacity Calculations
Calculation of Micropitting Load Capacity
The ISO/TS 6336-22:2018 calculation method of the micropitting load capacity is based on the principle that micropitting occurs when the minimum specific lubricant film thickness of a gear is below a permissible value for the specific film thickness. So, the safety factor against micropitting is defined as the ratio between the minimum specific film thickness of the lubricant and the permissible specific film thickness of the lubricant.
(1)
the minimum specific lubricant film thickness in the contact area
the local specific lubricant film thickness
the permissible specific lubricant film thickness
minimum required safety factor
ISO/TS 6336-22 does not give advice on a minimum safety factor that should be applied to avoid the risk of micropitting. Instead, it provides guidance for the selection of its value depending on the qualitative reliability of the assumptions on which the calculations are based and according to the reliability requirements. A recommendation for a reasonable minimum safety factor against micropitting, Sm, is proposed in (Ref. 18) as shown in Figure 7.
Figure 7—Micropitting safety factor according to Ref. 18.
The technical specification defines two methods Method A and Method B to determine the local specific lubricant film thickness. In method A, the local specific lubricant film thickness can be determined in the complete contact area by any appropriate gear computing program. Method B is a simplified method based on the assumption that the determinant local specific lubricant film thickness occurs on the tooth flank in the area of negative sliding. The calculation of the local specific lubricant film thickness is limited to certain points on the path of contact.
The local specific thickness of the lubricant film is defined by ISO 6336-22: 2018 as the ratio between the thickness (hY) of the lubricant film and the average roughness of the surfaces in contact.
(2)
Where:
hY is the local thickness of the lubricant film
Ra is the arithmetic mean effective roughness value
Ra1 is the arithmetic mean roughness of the pinion
Ra2 is the arithmetic mean roughness of the wheel
The local lubricant film thickness, hY, is calculated according to Dowson/Higginson
(3)
Where:
tn,Y is the normal radius of relative curvature at point Y
GM is the material parameter
UY is the local velocity parameter
WY is the local load parameter
SGF,Y is the local sliding parameter
The standard defines two methods to determine the permissible specific lubricant film thickness, mGFP.
Method A is the more accurate, which is based on experimental investigations or service experience relating to micropitting on real gears are used. For this method, the test gears need to have the same design as the actual gear pair, and by extension, the gear manufacturing, gear accuracy, operating conditions, lubricant and operating temperature must be appropriate for the actual gearbox. As a result, this method causes high costs. So, the cost required for this method is in general only justifiable for the development of new products as well as for gear pairs where failure would have serious consequences
Method B, the permissible specific lubricant film thickness, mGFP, is calculated from the critical specific lubricant film thickness, mGFT, which is the result of any standardized test method applicable to evaluate the micropitting load capacity of lubricants or materials utilizing defined test gears operated under specified test conditions.
Calculation of Macropitting Load Capacity
Currently, the most popular standards are ISO 6336:2019 and AGMA 2101-D04, these international methods allow the load capacity of metal gears to be verified by considering the two commonly used sizing criteria:
Generally, these international methods are based on the comparison of applied stresses with allowable stresses.
This calculation is performed using the KISSsoft 2022 software package.
AGMA and ISO design procedures are similar, with minor variations, and contain correction factors obtained from experiments and experience, which consider various uncertainties. These methods consider geometric design, material and heat treatment, manufacturing, and operating conditions.
The gear contact stress calculation is based on the Hertz theory, the formulas of maximum contact stress and the permissible contact stress for the two standards are presented below:
Where:
vH0 is the nominal contact stress
vH is the calculated contact stress
Ft is the nominal tangential load
u is transmission ratio
ZH is zone factor
ZE is elasticity factor
Zf is contact ratio factor
Zb is helix angle factor
Cp is elastic coefficient
dw1 is operating pitch diameter of pinion
ZI is geometry factor for pitting resistance, ZI plays somewhat the same role as the combination of the terms: (u+1)/u, Zf, Zb of ISO
d1 is pitch diameter of pinion
b is the facewidth
ZR is surface condition factor is supposed to take into account the surface condition, the residual stress state and the plasticity effects. At the moment there is no development and ZR =1.
To consider loading fluctuations due to the set-up, the driving and driven elements, the behaviour of the gear pair, the standards add K factors, to transform nominal contact stress in contact stress applied on the tooth flank:
KA (ISO) is the application factor
KV (ISO & AGMA) is the gear internal dynamic factor
KHb (ISO) is the face load factor for contact stress
KHa (ISO) is the transverse load factor for contact stress
Ko (AGMA) is overload factor
Ks (AGMA) is size factor
Km (AGMA) is load distribution factor
vHP is the permissible contact stress
vHlim (ISO), Sac (AGMA is the allowable contact stress number which determines the stress level that can be accepted by the material and its associated heat treatment. It is based on a Wöhler fatigue curve determined experimentally.
In this study, according to ISO, the allowable stress number vHlim was obtained from ISO 6336-5. It is derived from the contact pressure that may be sustained for 50×106 load cycles (for case-hardened steel) without the occurrence of pitting for a one percent probability of damage (99 percent reliability). The AGMA method defines the allowable contact stress value Sac for 107 load cycles with also 99 percent reliability.
SHmin is the minimum safety factor which is to be agreed on between the designer and customer. To consider the condition of the material in relation to the experimentally established data in a different environment the ISO & AGMA methods also introduce corrective factors.
ZNT is the life factor
ZL is the lubricant factor
ZR is the roughness factor
ZV is the velocity factor
ZW is the work hardening factor
ZX is the size factor for contact stress
ZN is stress cycle factor
KT is temperature factor
KR is reliability factor which allows the calculation of the gears for reliability levels other than one failure in 100 at 107 cycles
SH is safety factor for pitting
The contact stress vH should be less than the permissible contact stress for preventing failure. The safety factor against pitting is defined as the ratio between the permissible contact stress and the contact stress.
The AGMA standard includes the effect of surface condition, but it does not provide instructions or guidance for defining its value.
Analytical Results
The contact pressure stresses of the gear pair teeth and the specific lubricant film thickness are determined, using KISSsoft, at nominal torque (372.6 Nm) on the pinion and a speed of 2,250 rpm.
Micropitting
The specific sliding (Figure 8) at the root of the pinion teeth is high (3.75) and exceeds the value generally recommended according to the rules of art (3 in absolute value).
Figure 8—Specific sliding along tooth profile.
As shown in Figure 9, the maximum contact stresses occur in the pinion flank dedendum between the single contact point B and the pitch point C, when it meshes with the wheel addendum. The contact stress results reveal that micropitting can start in the pinion flank dedendum between point B and point C as this area is subject to a high level of contact pressure stresses.
Figure 9—Distribution of 2D and 3D contact pressures.
Figure 10 shows the variation of the lubricant film thickness along the tooth flank in a meshing cycle; this local thickness is derived from the Dowson and Higginson equation adopted by ISO/TS 6336-22.
As shown in Figure 11, the specific thickness of the lubricant film varies along the tooth flank during meshing, and the maximum film thickness occurs at the pitch point C due to pure rolling. The area between the start of the meshing A at the root of the pinion and the single contact point B presents the greatest risk of micropitting due to the lower lubricant film thicknesses accompanied by high-pressure contact stresses (Figure 9) compared to the other contact points along the line of action.
Figure 10—2D and 3D lubricant film thickness according to ISO 6336-22.
Figure 11—Comparison of specific lubricant film thickness.
The results obtained in terms of the specific lubricating film thickness m highlight the following points:
The unpeened (REF) and shot peened (SP) gears operated in a boundary lubrication regime (m
It can also be seen that the shot-peened gears have a higher m (Figure 11), as they have lower Ra values than the unpeened gears.
Figure 12 and Figure 15 show the safety of the gears against the micropitting according to ISO/TS 6336-22. The safety of the REF gear is lower than that of the SP gear because it has a lower local specific lubricant film thickness.
Figure 12—Micropitting safety on the path of contact of gears according to ISO 6336-22:2018.
Therefore, from the experimental tests conducted in this study, the ISO results of the specific lubricant film thickness provide a good correlation with the occurrence of micropitting on the tooth flanks, an example of the occurrence of micropitting on test gears is shown in Figure 14.
Macropitting
The theoretical lifetime of the gear is calculated according to both methods ISO 6336-2 and AGMA by calculating the number of cycles which leads to safety factor of 1.
The gear lifetimes obtained are presented below. The SHmin and SH are considered equal to one.
It should be noted that for all the tests carried out on the REF gears (unpeened) and shot peened (SP), no bending fracture at the tooth root was observed.
According to the ISO standard, the number of load cycles for the one percent probability of appearance of the first pitting on the pinion is 1.58 × 10⁶ cycles (11.7 hours) and that for a generalized pitting is 10.12 × 10⁶ cycles (75 hours). This correlates with the experimental results observed on case-hardened gears after 8.8 × 10⁶ load cycles. The number of pitting cycles for the different tests is plotted on the Wöhler curves at the corresponding contact pressure corresponding to the nominal operating torque as shown in Figure 15.
Figure 15—Wöhler curves comparison of pitting cycles.
However, when comparing the lifetime calculated according to the standards with that obtained experimentally on the shot-peened gears, macropitting occurred after 27.56 × 10⁶ cycles. The service life has increased by approximately 60 percent. This improvement can be explained by the increase of residual compressive stresses into the surface layer after the shot peening treatment.
The ISO standard considers the effect of shot peening on the improvement of the bending strength at the tooth root of carburized case-hardened gears. The benefit values attributed to shot peening are:
ML — 0 %
MQ — 10 %
ME — 5 %
But this standard does not consider this positive effect of the increase of the residual compressive surface stresses via the application of shot peening on the resistance to macropitting, which makes the gears load capacity calculations conservative.
Conclusion
The shot peening of ground flanks gears led to higher residual surface stresses compared to un peened ground gears flanks. The testing results show that micropitting occurs on the shot peened (SP) and unpeened gears (REF) after approximately the same running time, although the roughness parameters have lower values on shot peened gears. The micropitting area on the shot peened flanks is greater than that on the unpeened flanks for the same test durations.
The analytical results show that the gears have a specific lubricant film thickness m lower than 1, which is consistent with the fact that all surface conditions (shot peened and unpeened) led to the occurrence of micropitting. A good correlation is obtained between the experimental and analytical results in terms of the occurrence of micropitting in the dedendum area of gear teeth.
High safety factors according to ISO 6336-22 (>2) do not indicate the absence of micropitting as demonstrated by the test results. These observations agree with those made by Olson et al. (Ref. 19).
Shot peening did not delay the appearance of micropitting on gears but its evolution to macropitting/spalling. The shot peening has increased the life of the gear against pitting by more than 50 percent. This improvement introduced by residual surface stresses due to shot peening is not considered in the current standard calculation methods.
Further studies will be conducted to better understand the results obtained by analysis of the damage mechanisms and friction tests to measure the friction coefficient. These tests will allow us to find correlations between the friction coefficient and the surface condition after shot peening and they could enable us to optimize the shot peening parameters to improve the surface condition.
References
ISO 10825-1:2022 Gears—Wear and damage to gear teeth—Part 1: Nomenclature and characteristics.
Snidle, R-W., Evans, H-P., Alanou, M-P.and Holmes, M-J-A., 2004, “Understanding Scuffing and Micropitting of Gears” RTO-MP-AVT-109.
Champaigne,J., 2001, “Shot Peening Overview” from https://www.shotpeener.com/about/shot-peening/
Lambert, R. D., Aylott, C. J. and Shaw, B., A., 2018,” Evaluation of bending fatigue strength in automotive gear steel subjected to shot peening techniques”. Procedia Structural Integrity 13 1855–60.
Kobayashi, M. and Hasegawa, K. “Effect of shot peening on the pitting fatigue strength of carburized gears”. Proceedings of the IV International Conference on Shot Peening, 1990, 465–476.
Townsend, D. P., 1992, “Improvement in surface fatigue life of hardened gears by high-intensity shot peening,” NASA Report, Lewis Research Center.
Inoue, K. et al., 1989, “The Effect of Shot Peening on the Bending Strength of Carburized Gear Teeth,” The Japan Society of Mechanical Engineers, JSME International Journal, Series III, Vol. 32, No. 3.
Güntner, C., Tobie, T. and Stahl, K., “Influence of the residual stress condition on the load carrying capacity of case hardened gears”, AGMA Fall Technical Meeting 2017.
Kritzler, J.,2014, “Increasing the flank load capacity by combination of shot peening and superfinishing,” Metal Improvement Company, Unna, Germany, 12th International Conference on Shot Peening Goslar, Germany, September 15–18.
Koenig, J., Koller, P., Tobie, T., and Stahl, K., 2015, “Correlation of relevant case properties and the flank load carrying capacity of case-hardened gears.” Proceedings of the ASME 2015 International Design Engineering Technical Conferences and Computers and Information in Engineering Conference, Boston, MA.
Peyrac, C., Ghribi, D, F. Lefebvre, F.and Samuel, J., 2017, “Shot Peening for Surface Topography Optimization to Avoid Micro Pitting,” ICSP-13.
ISO/TS 6336-22 : 2018, “Calculation of load capacity of spur and helical gears—Part 22: Calculation of micropitting load capacity.”
ISO 6336-2 : 2019, “Calculation of load capacity of spur and helical gears—Part 2: Calculation of surface durability (pitting).”
ANSI/AGMA 2101-D04 (R2016), “Fundamental Rating Factors and Calculation Methods for Involute Spur and Helical Gear Teeth (Metric Edition).”
FVA Information Sheet No. 54/I-IV “Test procedure for the investigation of the micro-pitting capacity of gear lubricants,” July 1993.
FVA Information Sheet No. 371 “Practice Relevant Pitting Test”, October 2003.
Liu, H. , Zhu, C. and Zhou, Y.,2019, “A review on micropitting studies of steel gears,” Coatings 9.
Pinnekamp, B. and Heider, M., “Calculating the Risk of Micropitting Using ISO Technical Report 15144-1:2014—Validation with Practical Applications,” AGMA Fall Technical Meeting 2015.
Olson, R., Michaud, M., and Keller,J., “Case Study of ISOTS 6336-22 Micropitting Calculation,” AGMA Fall Technical Meeting 2020.
Printed with permission of the copyright holder, the American Gear Manufacturers Association, 1001 N. Fairfax Street, 5th Floor, Alexandria, Virginia 22314. Statements presented in this paper are those of the authors and may not represent the position or opinion of the American Gear Manufacturers Association.


 (1)
(1)


