The term white light sensor is unspecific and can be applied to multiple sensor technologies. In most cases, either confocal chromatic sensors or interferometric sensors are described with the term white light sensor. A confocal chromatic sensor is an advanced version of a confocal sensor, replacing the monochromatic light source with a broadband light source and the simple intensity-based point detector with a more complex spectrometer (Ref. 15, 16). This modification of the confocal setup gains the ability to get distance information over line area in space, via a smart interpretation of the spectrometer’s spectral information, but loses the lateral resolution and simplicity of the original setup. OEM and standalone systems are available from different suppliers (e.g., Micro-Epsilon, Precitec, Keyence). An interferometric sensor uses the low temporal coherence of the broadband light source and either a spectrometer or a tunable light source combined with a simpler intensity detector to generate distance information. A more detailed explanation can be found in a review paper about optical coherence tomography (OCT), a technology widely used in the medical and biological community (Ref. 17). Both technologies allow easy separation of the different optical components (e.g., sensor head, electronics, and light source) with the use of optical fibers, which allow easier thermal management.
Notable Mentions
There are combined tactile/optical measuring systems, e.g., the Werth Fiber Probe or the Renishaw SP25M (Refs. 18, 19). While interesting technology-wise, they seem to have a limited influence on the gear metrology community. This is comparably true for other methods, such as the use of the optical frequency comb or pure laser confocal sensors (Ref. 20). For small features of gears or very small gears (micro-gears), the focus variation technology or advanced scattering light techniques (Refs. 21, 22) can be used. Both methods are commercially available from different companies including Confovis, Keyence, Alicona, and Optosurf. However, even for small gears or features like roughness, tactile systems still are the gold standard. The phase unwrapping problem, which appears for different technologies (e.g., interferometry), is discussed for gear tooth flanks by Wang et al. in 2020 (Ref. 23).
Resolution, Accuracy, and Reproducibility
In the optical metrology field, the term resolution is used to describe the performance of a system. Lateral and axial resolutions, with different criteria (e.g., Rayleigh, Sparrow, and Abbe) and cases for coherent and noncoherent illumination are discussed in detail (Ref. 24). For gear metrology in the industrial context, this discussion is less important. Nevertheless, it is worth pointing out a few of the aspects with more precision.
Optical Spot Size vs. Tactile Touching Size
It is known that the size (diameter) of the used orb of the tactile measurement system influences the measurement results. The influence can be described using a mathematical morphological filter to describe or simulate the mechanical filter of the stylus, as standardized in the DIN EN ISO 16610-41. It is even discussed if multiscale morphological filters can be used directly for gear fault detection, however with noise data instead of geometry data (Ref. 25). The crucial point is that there is a difference between the actual surface of the specimen (gear) and data points of features seen on the measurement sheet. In general, this difference depends on the size and physical behavior of the measurement point as well as additional filters used by the measurement software. A typical result is shown in Figure 1.
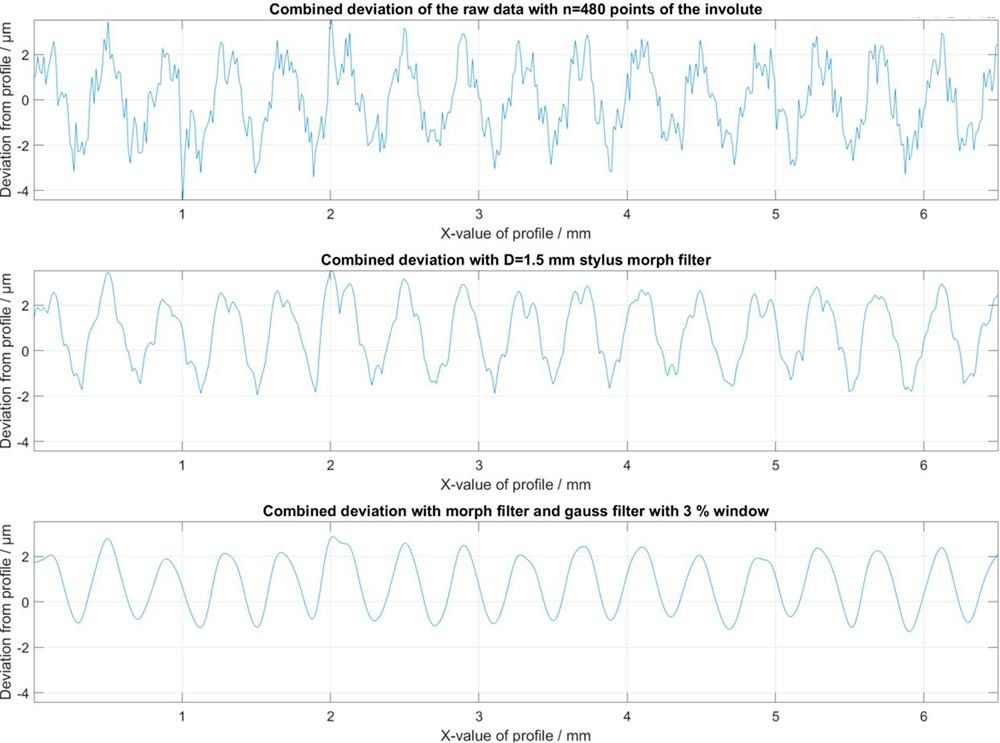
Figure 1—The row on top shows a simulated profile deviation with 480 data points over a 6.5 mm rolling path of a gear profile. The row in the middle shows the influence of a morphological filter with a 1.5 mm stylus. The row at the bottom shows the data with a Gaussian filter (3 percent window) applied.
By interpreting the results, the reader must keep in mind that the data is a simulation, with the sole purpose of demonstrating the influence of the mechanical filter of the stylus (illustrated by a morphological filter) and a Gaussian filter as seen on a typical gear measurement sheet. What can be seen from this example is that while the high-frequency component may change drastically, the low-frequency component of the signal (profile deviation) is mostly unchanged. Therefore, depending on the type of feature of the gear, the data may change depending on the stylus size as well as on the measuring technology. The reason for this is that most optical systems have a smaller spot size or touching area on a gear flank compared to a tactile stylus on technical surfaces. In addition, it is a fact that the “touching” physics or interaction between measurement systems and objects is different between mechanical and optical systems. In other words, the accuracy of the data is related to the feature type (low or high frequency) on the gear and the used metrology technique (touching size and physics). To enable the highest accuracy, some kind of expert knowledge, possibly provided by intelligent software algorithms developed by the metrology manufacturer or the science community is needed.
Accuracy and Reproducibility
A method commonly used for a measurement system analysis is a type 1 study, which will result in Cg and Cgk values acquired from a series of at least n = 25 measurements (Refs. 26, 27). The Cg value gives information about the reproducibility, mainly indicated by the standard deviation (sigma) of the measurement process, and the Cgk value adds information about the accuracy (the difference between the measure value and the actual value) of the study.
The Cg value is defined as:
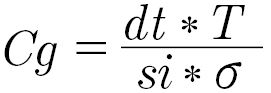
where dt is the drawing tolerance factor with a default value of 20 percent (0.2), T is the drawing tolerance itself, si is a sigma interval factor (typically four, sometimes six) and v is the standard deviation. The target value commonly used for Cg as well as Cgk is 1.33. The standard deviation v is given by:
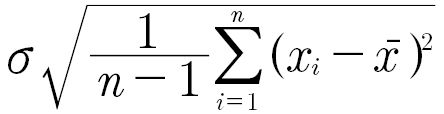
With n (25 or more) indicating the number of measurements, xi the measurement with the index i and x̄
the mean value of all n measurements.
A quick example of the needed standard deviation for given tolerances from a customer with a target Cg of 1.33, dt of 0.2 and a si of six is shown in Figure 2.
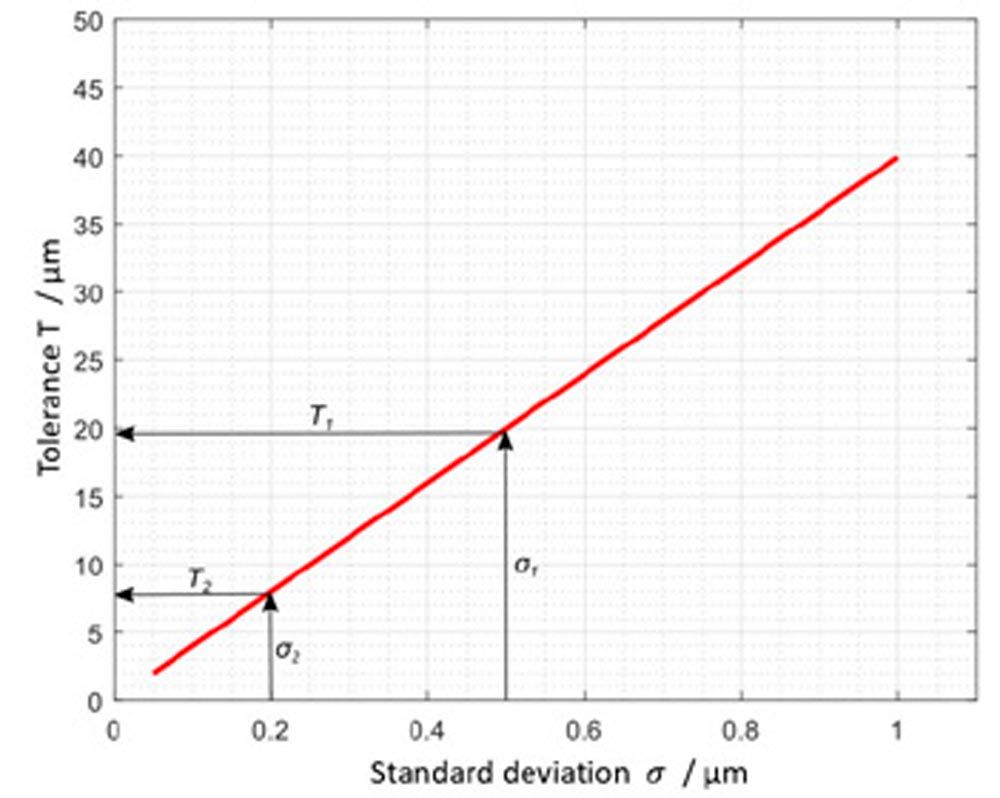
Figure 2—Drawing tolerances and needed standard deviation for an example with a target Cg of 1.33.
While the reproducibility required is given by the drawing tolerances and depends on the application, a good value for most gear features in the automotive industry is a standard deviation around 0.1 µm.
Setup
For the experiment, a sixth-generation Klingelnberg P26 metrology system configured for hybrid metrology with the optical sensor package together with the corresponding September 2021 software release was used. The tactile system applied was the Klingelnberg proprietary 3D Nanoscan tactile probing system. The optical system is the proprietary, contactless HISPEED OPTOSCAN, based on a custom white light sensor with an approximate spot size of about 12 µm.
Basic Accuracy and Reproducibility of an Optical Sensor on a CMM
The fundamental limit in terms of accuracy and reproducibility of a CMM is given by its capability to define and retrieve its center / zero position, or in other words defined by the calibration. While this limit is influenced by the capabilities (e.g., resolution) of the optical sensor itself, it is also affected by the mechanical and thermal stability of the CMM chassis, the quality of the translation stages, the motor control units, the temperature control, filters applied by the software and multiple other impacts.
A study to define the reproducibility of this calibration process is normally done under well-defined conditions in a highly controlled environment, for example in a vibration-isolated climate chamber with minimal user influence. A Klingelnberg hybrid P26 was used under these conditions and analyzed in a study with a sample size of n = 100. The results are shown in Figure 3.
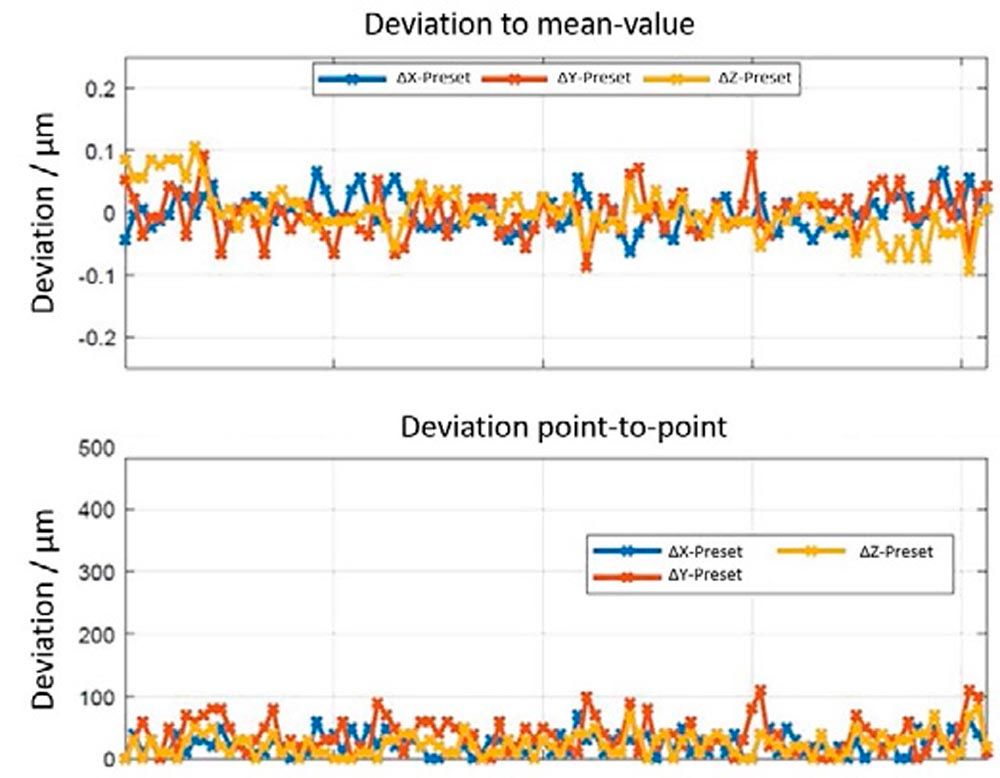
Figure 3—Preset study with n = 100 measurements under controlled conditions. The diagram on the top shows the deviation for every axis (x-y-z) to the mean value, and the diagram at the bottom shows the measurement-to-measurement variation.
The results indicate a maximum error of around 200 nm with a standard deviation of 28 nm for the x-axis component, 35 nm for the y-axis component, and 38 nm for the z-axis component under near-perfect conditions. In terms of a measurement systems analysis, this would lead to process-ready tolerance, for a rather challenging target of Cg = 1.33 with a six v interval and 0.2 drawing tolerance of 1.6 µm.
Physical Limitations
While optical metrology is commonly used in different industrial, medical, and biological fields, the gear community is notoriously skeptical about its performance and behavior and there are limitations for optical gear metrology given by the physical interaction between light and matter.
Absorption and Reflection
The major limitation of this method is the fact that every optical metrology system needs light that gets back to some type of detector unit. Two physical processes may limit this path: Absorption and reflection. A target with a rather high light absorption, a mat black one, for example, will never be a good target for optical metrology. This is also true for targets with very high reflectivity, e.g., mirror-like objects, because the light will follow the laws of reflection, which in cases of gear metrology normally means that the reflecting light does not reach the sensor again. While both cases are possible in the gear industry, they are very unlikely to appear in the automotive industry and even in the whole industry itself. A similar, albeit uncommon case is transparent (plastic) gears, which will lead to a superposition of optical depth information and thus to a rather high need for data post-processing.
Dirt, Dust, Rust, and Oil
Unlike a tactile stylus, which has limited influence of dirt on the measurement results, the contactless optical technology will measure every obstacle in the light path as part of the object. A clean and dry object is required to achieve the highest quality levels. If the standard cleaning process of gears during production—centrifuging and the use of air pressure—is carefully executed, this is considered to not have a significant influence on the results. However, this needs to be checked in advance.
Shadowing and Probing Angle
Depending on the sensor technology used, for example, if the illumination and detection light beam is separated, the typical geometry of gears may lead to shadowing. This means that a part of the gear is blocked by other parts, which leads to dead spaces on the gear. This can be partly avoided by a sophisticated calculation of the measurement movement, often in combination with an additional rotation and/or translation stage for the sensor head.
In comparison to a tactile probe, where the touching process is always orthogonal to the surface, this is not the case for most optical sensor systems. If an optical sensor head would follow the gear’s geometry, a major part of its speed advantage would be diminished. The influence of this process needs to be considered. However, this is mostly relevant for high-frequency features, like roughness.
In the next section, a real-world example of an optical/hybrid metrology task for gear analysis will be provided. This example focuses on the pitch measurement of gears. This is an industry standard metrology task for gears, which causes a major part of measurement time, compared to other metrology tasks. The goal is to demonstrate the improvement of the hybrid metrology concept compared to a tactile-only approach to measurement speed. In addition, the general accuracy of the system is demonstrated by carrying out a calibration study.
Example of a Hybrid Metrology Use Case
While the results measured in a very controlled environment are a demonstration of the best-case scenario, experienced engineers will ask about a real-world scenario.
The following results were received during the standard pre-acceptance of a Klingelnberg hybrid P 26. The measuring conditions are comparable to a temperature-controlled shop floor. This means it was definitely not a high-class metrology room, but also not a worst-case shop floor scenario. For the first part of the acceptance procedure, a calibration (preset) study with n = 25 was performed. The results are shown in Figure 4.
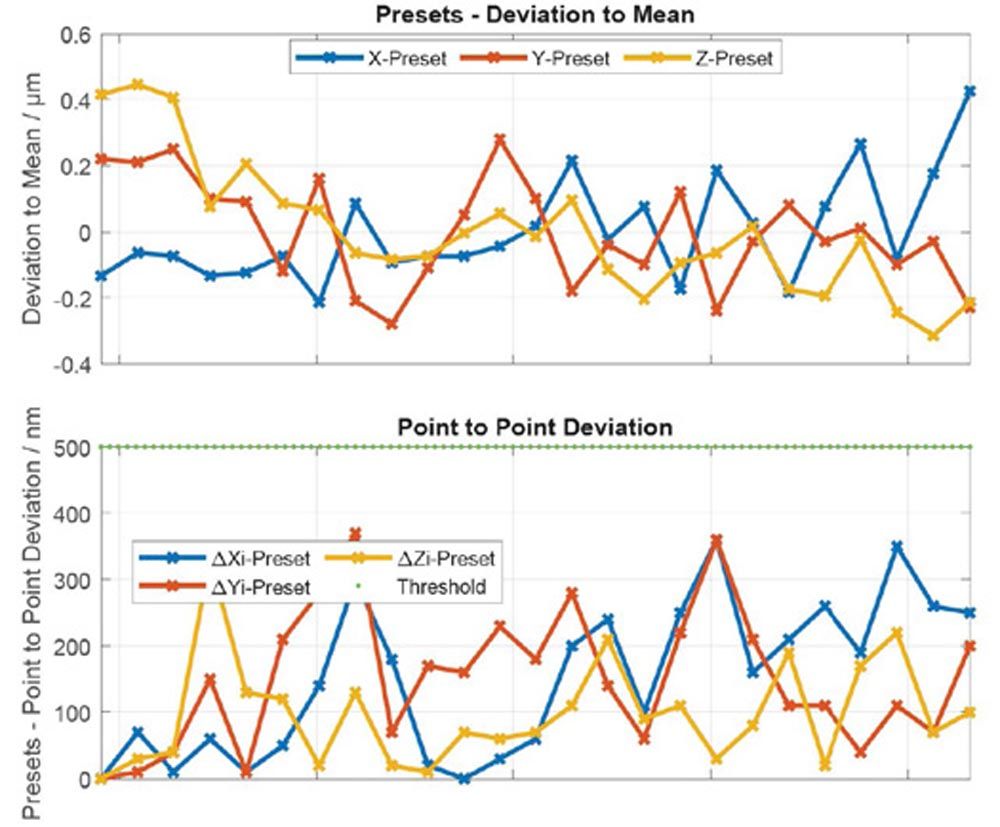
Figure 4—Preset study with n = 100 measurements in a production hall using the optical sensor of a Klingelnberg hybrid P 26. The diagram at the top shows the deviation for every axis (x-y-z) to the mean value, and the diagram at the bottom shows the measurement-to-measurement variation.
The results indicate a maximum error of around 640 nm with standard deviations of 156 nm for the x-axis component, 161 nm for the y-axis component, and 200 nm for the z-axis component.
For the second part, a DAkkS certified gear with z = 63 teeth, a normal module of mn = 1.52 mm, a pressure angle of 17 degrees and a helix angle of 31.5 degrees was used in a type 1 study with n = 25 measurements. The tolerances for a gear in quality class 4 based on DIN ISO 1328 as needed for a measuring machine of class A based on VDI/VDE 2612 / 2613 were used. According to the pre-acceptance procedure, the drawing tolerance factor was 0.2 and a four-sigma interval was used. The results are shown in Figure 5.
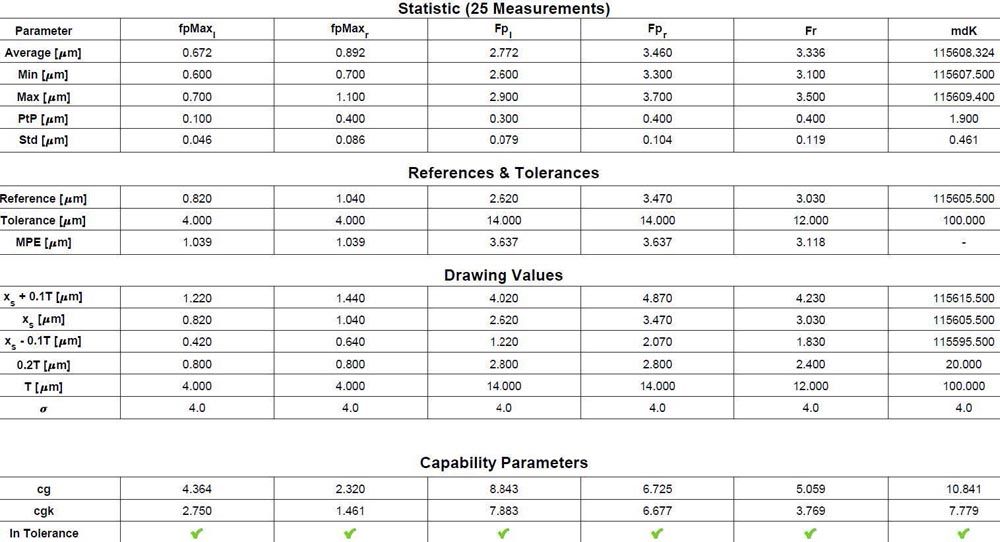
Figure 5—Statistical analysis of the type 1 study with n = 25 measurements showing Cg and Cgk values significantly larger than target of 1.33 for all index features, indicating a capable measuring tool. Measurement performed using the optical sensor of a Klingelnberg hybrid P 26 in a production environment.
The used parameters for the pitch deviation analysis are described in ISO 1328, fpMax is the largest value of the single pitch deviation, Fp is the total cumulative pitch deviation in µm, Fr is the runout in µm and mdK is the diametral dimension over balls in µm. The index l indicates the left flank of a gear, and r is the right flank of a gear.
The speed improvement of the optical index measuring method compared to the tactile (point) method is about 70 percent for the used gear and even larger for the tactile flank method. It depends on the normal module of the gear as well as the pressure angle. Compared to a gear with a pressure angle of 17 degrees, a slightly larger pressure angle (e.g., 20 degrees) would lead to an even larger speed benefit, typically reaching around 80 percent speed gain. Speaking about relative values, the absolute gain in measurement time also depends on the number of teeth. More teeth will in general lead to a larger time benefit for the optical method.
Discussion
The practical results of the optical index measuring method performed on a Klingelnberg hybrid P 26 indicate a couple of conclusions:
The optical metrology for index measuring is a capable tool to speed up gear measuring even for high-quality gears based on the type 1 study results with some headroom left.
The relative speedup for the index measuring can be rather high (80 percent) which has an impact on the overall measuring time since the index measuring is the most time-consuming measurement. The general time improvement or better daily gain in throughput of gears depends on the number of other tasks performed for the complete quality control process, as well as the gears geometry. A typical process of measuring the profile and lead on four teeth, a torsion check on the first tooth, index measuring, run-out and tip- and root-diameter with workpiece axis position detection can still benefit from an optical index measurement indication between 15 percent to 30 percent gain in gear per day throughput.
The preset measurement in a normal production environment shows a small drift of preset values according to temperature changes, as seen in Figure 4. This drift of preset values is related to the expansion of material (e.g., used to hold optical components) based on the temperature change. With additional adjustments of the temperature compensation model to include the optical system, this drift can be minimized in the future. The goal is to achieve an optimized standard deviation in a standard production environment.
Optical metrology for gears is only accepted if the speed improvement does not come with losses in accuracy or reproducibility. Both need to be checked with studies using a certified master part in a real-life environment. The gear measuring community is challenged by rather low tolerances for modern gears, especially in e-mobility, in the tactile and optical metrology world.
The results of this study indicate a strong benefit for hybrid pitch measurements compared to a tactile-only approach. The future will show whether this technology will find wide acceptance in the industry. However, from our perspective this technology is promising.
Summary and Outlook
Based on today’s technology, optical metrology is a capable tool if embedded in a hybrid metrology concept to enhance users’ gear metrology experience. It can improve measurement speed for specific tasks (e.g., for index measuring), and thus can reduce quality costs.
In addition, optical metrology will be beneficial for future measuring tasks, if they have rather large complexity. All future quality control strategies, like topographic measurements, 100 percent Industry 4.0, closed loop, or holistic approaches, will require sophisticated measurement strategies. Therefore, modern quality control will benefit from fast optical metrology. If the optical metrology has a similar or better accuracy compared to the tactile gold standard.
We think the hybrid approach, while still needing some fine tuning and a broader set of features, is the future of gear metrology.
Disclaimer
The authors are employees of Klingelnberg GmbH, Germany. Both are directly responsible for the R&D of the hybrid metrology concept demonstrated and discussed in this publication.

References
- R.G. Munro, “The use of optical gratings in gear metrology,” Transactions on Engineering Sciences, Vol. 16, 1997.
- G. Goch, “Gear Metrology,” CIRP Annals, Vol. 52, Issue 2, 2003.
- K. Meeß et al., “Reducation and Evaluation of the Uncertainty of Measurement of Optical Gear Measurement using Fringe Projection,” tm—Technisches Messen, Vol. 73, No. 11, 2006.
- C. Sciammarella et al., “High-accuracy contouring using projection moiré,” Optical Engineering, Vol. 44, No. 9; 2005.
- SP Fang et al., “Design of laser interferometric system for measurement of gear flank,” Optik, Vol. 122, No. 14; Elsevier, 2011.
- WO 2013/081187 A1, 06.06.2013, Nikon Corporation, Yamaguchi, Masaya; Priority JP 2011262838, 30.11.2011.
- Christian Albrecht, https://www.gleason.com/en/facts-and-news/news-room/revolutionizing-gear-inspection-control-2019-in-stuttgart, Gleason Corporation, source from Apr. 17, 2019; last visit May 16, 2022.
- Schiller et al., “Optical gear measurement: holographic system for 100 percent inspection,” International Conference on Gears, 2019.
- L. Rajagopalan, “DWFritz Receives Frost & Sullivan Best Practices Award,” Press release, DWFritz Automation, Inc, 9600 SW Boeckman Rd, August 2020.
- G. Mies, “New hybrid technology for tactile and optical measuring technology,” Klingelnberg GmbH, White Paper, 2018.
- Dorsch et al., “Laser triangulation: fundamental uncertainty in distance measurement,” Applied Optics, Vol. 33, No.7; 1994.
- M. Pillarz et al., “Gear Shape Measurement Potential of Laser Triangulation and Confocal-Chromatic Distance Sensors,” Sensors, Vol. 21, p. 937; 2021.
- K. Meeß et al., “Reduction and Evaluation of the uncertainty of Measurement of Optical Gear Measurement using Fringe Projection,” TM, Vol. 73; 2006.
- C.A. Sciammarelle et al., “High-accuracy contouring using projection moiré,” Opt. Eng., 2005.
- M. Minsky, “Memoir on inventing the confocal scanning microscope,” Scanning, Vol. 10, No. 4; 1988.
- Molesini et al., “Focus-Wavelength encoded optical profilometer,” Optics Communications, Vol. 49; 1984.
- Joseph M. Schmitt, “Optical Coherence Tomography: A Review,” IEEE Journal of Selected Topics in Quantum Electronics, Vol. 5, No. 4; 1999.
- M. Petz et al., “Tactile-optical probes for three-dimensional microparts,” Measurement, Vol. 45, Iss. 10; 2012.
- D. R. McMurtry, A. G. Butter, “Measuring probe with modules,” EP 1 505 362 B1; 2005.
- J. Hall & T. Hänsch, “The noble prize in physics 2005,” 2005.
- R. Danzl et al., “Focus variation—a new technology for high resolution optical 3D surface metrology,” conference paper, Citeseer; 2009.
- J. Seewig et al., “Extraction of shape and roughness using scattering light,” Proc. SPIE 7389; 2009.
- Xian Wang et al., “Phase unwrapping based on adaptive image in-painting of fringe patterns in measuring gear tooth flanks by laser interferometry,” Optics Express, Vol. 28, No. 12; 2020.
- R.P.J. Nieuwenhuizen et al., “Image resolution in optical nanoscopy,” Nat. Methods, Vol. 10, No. 6; 2013.
- B. Li et al., “Gear fault detection using multi-scale morphological filters,” Measurement, 2011.
- “Measurement system analysis made easy,” Helmut Fischer GmbH, In Surf Technol 14; 2021.
- V. Tuominen et al., “Verification of the accuracy of a real-time optical 3D-measuring system on production line,” Int arch Photogrammetr, rem Sens spatial inform Sci 38; 2008.