


Influence of Grain Size on Metallurgical Properties
This report discusses grain size and its influence on metallurgical properties including its effect on yield strength, ultimate strength, fatigue strength, and fracture toughness. Also discussed are manufacturing issues such as heat treatment, hardenability, and machinability. Figures 1 through 4 in this report are from Ref. 1. For figure credits see Ref. 1.
| Austenitic Grain Size | ||
Property | Fine | Coarse |
Hardenability | Lower |
[advertisement]
Higher |
Hardening depth | Shallow | Deep |
Retained austenite | Less | More |
Distortion in quenching | Less | More |
[advertisement]
Depth of carburizing | Less | More |
Risk of quench cracks | Less | More |
Risk of grind cracks | Less | More |
Residual stress | Lower | Higher |
Embrittlement by cold working | Less | More |
Hardness | Higher | Lower |
Yield strength | Higher | Lower |
Ultimate strength | Higher | Lower |
Fatigue strength | Higher | Lower |
Fracture toughness | Higher | Lower |
Machinability after normalizing | Lower | Higher |
Machinability after heat treat | Higher | Lower |

Table 1—Influence of Grain Size on Metallurgical Properties.
Influence of Tensile Strength on Fracture Toughness
Figure 1 shows that fracture toughness decreases with increasing tensile strength and increasing sulfur content.
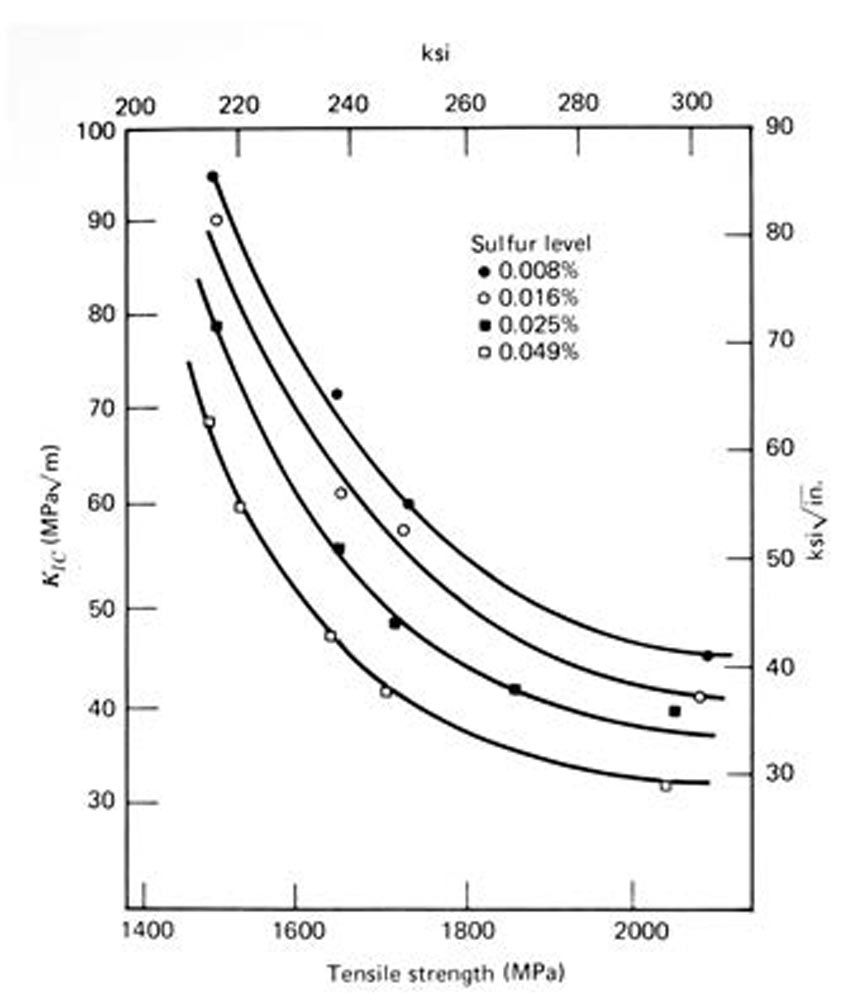
Figure 1—Influence of tensile strength and sulfur content on fracture toughness.
Influence of Grain Size on Tensile Strength and Fracture Toughness
Figure 2 shows that grain refinement represents a unique opportunity where steel may be both strengthened and toughened. This is a particularly attractive strengthening mechanism in view of the generally observed inverse relationship between strength and toughness as shown in Figure 1. Note that weldability and ductility are not adversely affected.
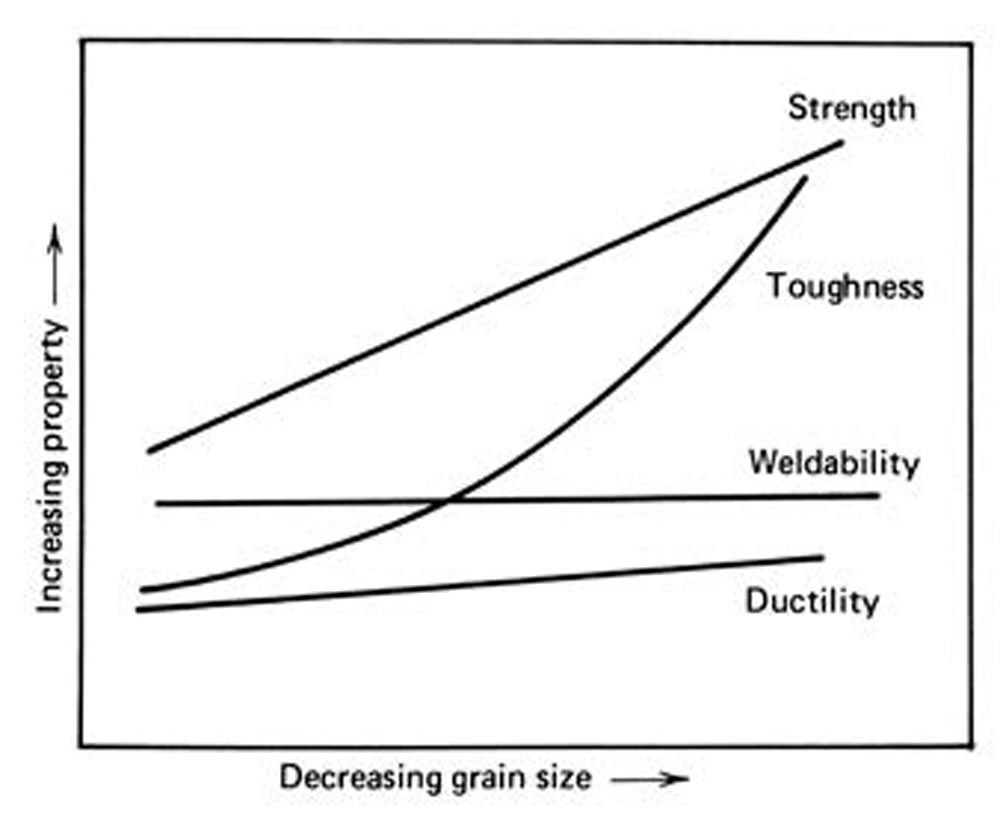
Figure 2—Improvement of tensile strength and toughness with decreasing grain size.
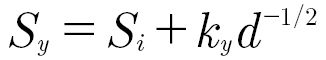
Influence of Grain Size on Yield Strength
Plastic deformation is caused by dislocations moving on a slip plane within a grain. The grain boundary acts as an obstacle to dislocation movement and a group of dislocations pile up at the grain boundary creating a back pressure (pile-up stress) that resists further dislocation movement. Because the grain boundary totally encompasses the slip plane of the dislocations, the dislocations within the grain cannot go around the obstacle as they could with a point obstacle. The stress required to force a dislocation across a grain boundary is so high that the probability of slip propagating from one grain to the next is remote. However, stress concentration at the tip of a slip band can be high enough to activate dislocation sources in the neighbor grain across the boundary. The magnitude of the stress concentration caused by the dislocation pile-up depends on the number of dislocations in the pile-up, which is a function of the length of the active slip plane; larger grains have larger slip planes and more dislocations in the pile-up. Therefore, larger grains lead to lower yield strength. In the case of irregular grain shapes, the longest dimension of the grain is the relevant grain size for yield strength.
Hall-Petch Relation
Small grains have greater ratios of surface area to volume, which means a greater ratio of grain boundary to the number of dislocations, and since grain boundaries impede dislocation movement, fine grains increase yield strength, which is expressed by the Hall-Petch relation (Refs. 2–3):

 (1)
(1)
Where:
Sy = yield strength;
Si = lattice resistance to dislocation movement;
ky = dislocation locking term;
d = average grain diameter.
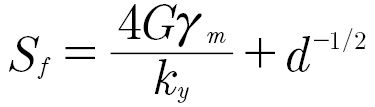
Influence of Grain Size on Fracture Strength
The fracture stress is related to grain size by Equation 2:
(2)
Where:
Sf = true fracture stress;
G = shear modulus;
cm = plastic work done around a crack as it moves through the crystal;
ky = dislocation locking term from Hall-Petch relation Equation 1;
d = average grain diameter.
Figure 3 shows that the fracture stress Sf is more sensitive to grain size than the associated yield strength Sy. For grains smaller than ASTM E112 number 3, yielding occurs first and is followed by eventual fracture after a certain amount of plastic flow, the amount increasing with decreasing grain size. Since Sf and Sy are both temperature-sensitive properties, the critical grain size for the ductile-brittle fracture transition varies with temperature. See Figure 4 for more information.
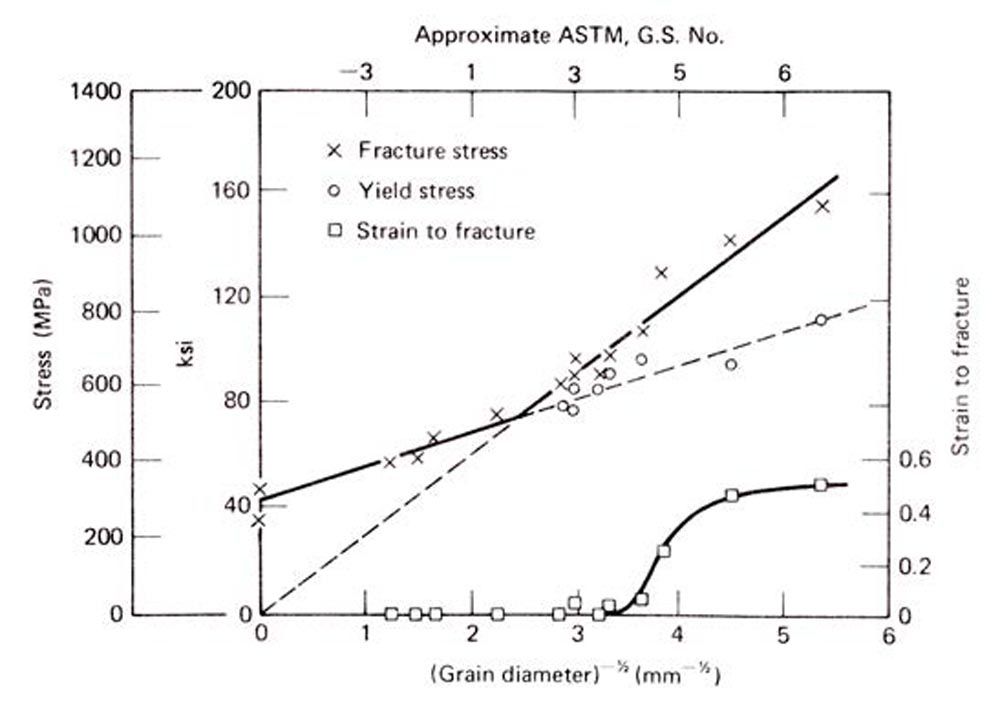
Figure 3—Yield and fracture strength, and fracture strain dependence on grain size in low carbon steel at -192 °C.
Figure 4 shows the dependence of ductile-brittle transition temperature Tc on grain size. The ductile-brittle transition temperature decreases strongly with decreasing grain size (increasing ASTM grain size number).
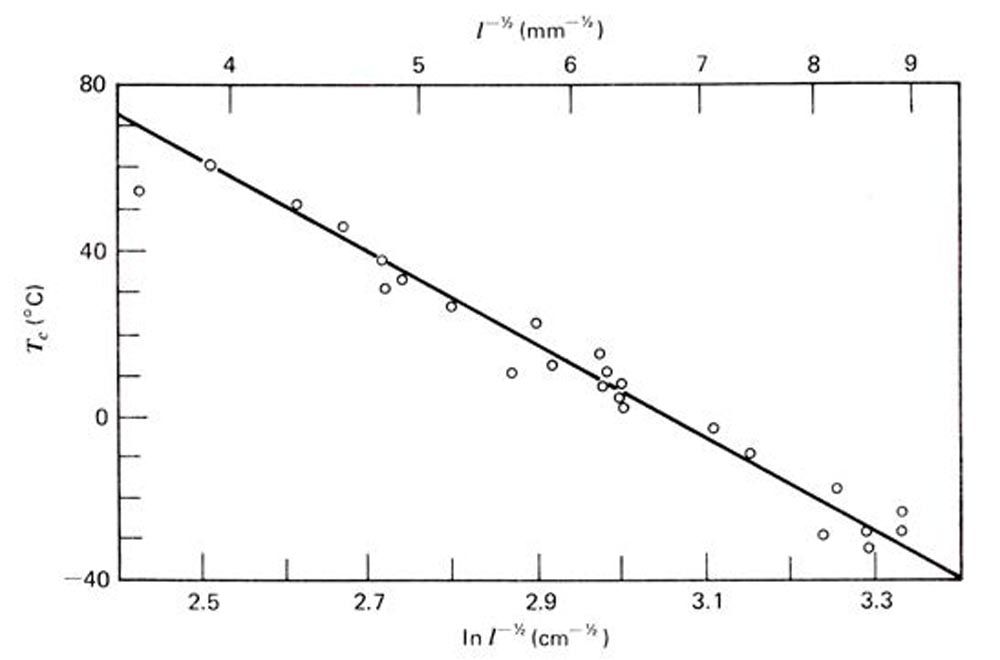
Figure 4—Dependence of ductile-brittle transition temperature on grain size.
Influence of Grain Size on Hardenability and Machinability
Very fine grain size reduces hardenability and consequently gives lower tooth core hardness and gives less case depth. Furthermore, very fine grain size reduces machinability. Depending on the steel alloy, grain size should be no finer than ASTM E112 number 9.
Summary of Influence of Grain Size
Small grain size increases yield strength and fracture strength (Figure 3). Small grain size also increases fatigue strength because fatigue strength is a function of yield strength. Furthermore, small grain size decreases the ductile-brittle transition temperature, which increases fracture toughness (Figure 4). On the other hand, very fine grain size (finer than ASTM E112 number 9) reduces hardenability and machinability.
Measuring Grain Size
ASTM E112 (Ref. 9) specifies standard test methods for estimating average grain size. There are three methods:
- Standard series of graded chart images.
- Planimetric method.
- Intercept method.
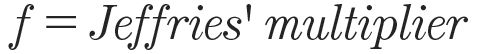
The planimetric or Zay Jefferies method (Ref. 6) uses a test circle superimposed over the microstructure. All the grains that are completely inside the test circle are counted, plus all the grains that are intercepted by the circle. It is assumed that, on average, half of the intercepted grains are inside the test circle and half are outside. The number of grains per square millimeter NA and grain size G are calculated from:
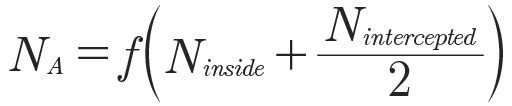
(from ASTM E112 Table 5)


The Heyn lineal intercept method (Ref. 7) was suggested by Heyn in 1903 and revised by Halle Abrams in 1974. It uses a three-concentric circle test grid superimposed over the microstructure. The grain boundary intersections are counted, and the count is divided by the true line length, which is the line length divided by magnification. This yields the number of intersections per unit length. The reciprocal of the intersections is the lineal length L3. The average grain size is given by the equation:

Failure Mode Relevant Grain Size and Critical Area
The use of the mean (average) grain size is difficult to justify, since yield, fatigue, and fracture are “weakest link” phenomena that are controlled by the largest grain size (Ref. 4). Furthermore, the location of the critical largest grain is dependent on the failure mode. For example, the critical areas for each failure mode of gear teeth are:
Failure mode | Critical area |
Macropitting | On the tooth flank at the lowest point of single tooth contact (LPSTC) at a depth of the maximum shear stress. |
Subcase fatigue | On the tooth flank at the LPSTC at a depth of 2.5 times the effective case depth. |
Bending fatigue | On the surface of the tooth root at the 30-degree tangent to the root fillet. |
Subsurface initiated bending fatigue | On the tooth flank near mid-height of the tooth usually at the depth of a nonmetallic inclusion. |
Tooth interior fatigue fracture (TIFF) | On the tooth flank near mid-height of the tooth and on a flat plateau at a depth near the case/core boundary. |
Case/core separation | Below the top land at a depth near the case/core boundary. |
Table 2—Location of critical area versus failure mode.
Controlling Grain Size
For optimal properties, it is essential that the grain size of carburized and hardened components is both uniform and fine (Ref. 5). Grain refinement is accomplished by adding certain elements, for example, aluminum or vanadium to the molten steel in the ladle after a thorough deoxidation treatment, usually with silicon. Additions of aluminum, vanadium, or both, encourage the formation of compounds, for example, aluminum nitride AlN or vanadium carbide V4C3 that, because of their extreme fineness and relative stability can mechanically restrain grain boundary movement during subsequent austenitizing heat treatments. A normalize heat treatment, or a normalize, quench, and temper treatment, before carburizing favors an initially uniform and small grain size. The duration of the austenitizing treatment is important, for example, steel with 0.020 percent Al was fine grained (ASTM 7) when austenitized at 927 °C for one hour, whereas at 10 hours at the same temperature the average grain size increased to about ASTM 3 (see Figure 5.3b in Ref. 5). Grain size is influenced by the chemical composition, mechanical and thermal history, and the carburizing temperature. Re-heat quenching from near the Accm temperature favors a fine-grain structure.
Increasing the temperature at which low-pressure carburizing is performed runs the risk of abnormal grain growth (Ref. 8). Steels that contain aluminum and nitrogen with aluminum to nitrogen ratio of Al/N > 2.1, and preferably 2.2, have AlN particles that pin the grain boundaries and prevent or minimize grain growth during austenitizing (Ref. 8). The optimal Al/N ratio depends on the specific steel alloy, forging reduction ratio, cold working prior to heat treatment, heat treatment prior to carburizing, heat treatment during carburizing, and method of quenching and tempering. However, Al and N can have harmful effects when added excessively, Therefore, the optimal Al/N ratio can range from 2.0 to 3.5 depending on the variables listed, and it is best to experimentally determine the optimal Al/N ratio for the actual conditions.
Subcase Fatigue Caused by Large Grain Size
Figure 5 shows a large grain size that was located below the case/core boundary, which was the root cause of a subcase fatigue failure of a carburized gear. The depth of the cracks was 2.5 times the effective case depth. The grain size of the largest grain was ASTM 2. However, the longest length within the grain was about 250 µm, which was probably the length of the longest slip plane and was associated with high-stress concentration due to a dislocation pile-up; that is, the weakest link. Note that the next largest grain corresponds to ASTM 3 grain size.
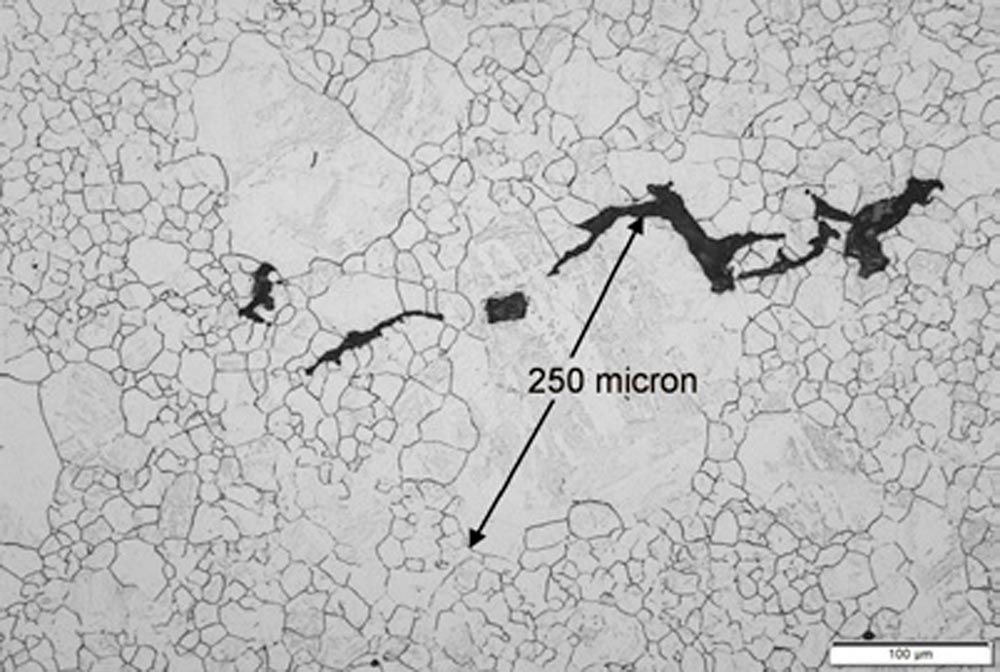
Figure 5—Large grain size below case/core boundary.
Conclusions
- Grain refinement represents a unique opportunity where steel may be both strengthened and toughened.
- Small grain size increases yield strength, ultimate strength, fatigue strength, and fracture toughness.
- Yield, ultimate, fatigue, and fracture strength are “weakest link” phenomena that are controlled by the largest grain size in a critical area of the gear tooth.
- The location of the critical largest grain is dependent on the failure mode.
- To maintain hardenability and machinability, the grain size should be no finer than ASTM E112 number 9.
- Steels that contain aluminum and nitrogen with aluminum to nitrogen ratio of Al/N = 2.0 to 3.5 have AlN particles that pin the grain boundaries and prevent or minimize grain growth during austenitizing.
Recommendations
- AGMA 923 grain size specification should be 90% of the grains ASTM E112 number 5-8 and no grain larger than ASTM E112 number 3 and no grain smaller than ASTM E112 number 9.
- Metallographic inspection of grain size should be performed at all critical areas on a representative coupon of a gear tooth.
- For failure analyses, the metallographic inspection should be performed at the crack initiation point.
- The optimal Al/N ratio can range from 2.0 to 3.5 depending forging, cold working, and heat treatment, and it is best to experimentally determine the optimal Al/N ratio for the actual conditions.

References
- Richard W. Hertzberg, Deformation and Fracture Mechanics of Engineering Materials, Second Edition, John Wiley & Sons, 1983.
- Hall, E.O. “The Deformation and Ageing of Mild Steel: III Discussion and Results,” Proceedings of the Physical Society. Section B, 64, 747, 1951. https://doi.org/10.1088/0370-1301/64/9/303
- N. J. Petch, “The Cleavage Strength of Polycrystals,” Journal of the Iron and Steel Institute, Vol. 174, pp. 25–28, 1953.
- J.W. Morris Jr., “The Influence of Grain Size on the Mechanical Properties of Steel,” Lawrence Berkeley National Laboratory, 2001. https://escholarship.org/uc/item/88g8n6f8
- Geoffrey Parrish, “Carburizing: Microstructures and Properties,” ASM International,1999.
- George Vander Voort, “Grain Size Measurement: The Jefferies Planimetric Method,” 2012.
- George Vander Voort, “Grain Size Measurement: The Heyn Intercept Method,” 2012.
- Elias Nybacka Reiland, “Aluminum Nitride-containing Steels for High-Temperature Low-Pressure Carburizing Processes,” KTH Royal Institute of Technology, 2022.
- ASTM E112, “Standard Test Methods for Determining Average Grain Size,” ASTM, 2021.
