The gear fatigue tests were performed in the NASA Glenn Research Center’s gear test apparatus. The test rig is shown in Figure 1(a) and described in Reference 24. The rig uses the four-square principle of applying test loads, and thus the input drive only needs to overcome the frictional losses in the system. The test rig is belt driven and operated at a fixed speed for the duration of a particular test.
A schematic of the apparatus is shown in Figure 1(b). Oil pressure and leakage replacement flow is supplied to the load vanes through a shaft seal. As the oil pressure is increased on the load vanes located inside one of the slave gears, torque is applied to its shaft. This torque is transmitted through the test gears and back to the slave gears. In this way power is circulated, and the desired load and corresponding stress level on the test gear teeth may be obtained by adjusting the hydraulic pressure.
The two identical test gears may be started under no load, and the load can then be applied gradually. To enable testing at the desired contact stress, the gears are tested with the faces offset as shown in Figure 1. By utilizing the offset arrangement for both faces of the gear teeth, a total of four surface fatigue tests can be run for each pair of gears. The test gears were run with the tooth faces offset by a nominal 3.3 mm (0.130 in) to give a nominal surface load width on the gear face of 3.0 mm (0.120 in). The precise width of the running track will be influenced by gear tooth facewidth tolerances and by the shape and radius of the edge breaks. In this work, post-test inspections were used to determine the running track widths, as will be discussed later in this report.
All tests were run-in at a torque load of 14 Nm (130 in-lb) for at least one hour. The torque was then increased to the test torque of 72 Nm (640 in-lb). For this test torque, the peak of the Hertz pressure distribution for line contact condition at the pitch-line and static torque equilibrium is 1.7 GPa (250-ksi). Typical dynamic tooth forces have been measured using strain gages located in tooth fillets. Using calibration coefficients determined by specialized calibration experiments (Ref. 25) typical gear tooth forces were calculated from measured tooth fillet strains (Fig. 2). The resulting peak dynamic tooth force is about 1.3 times greater than the force for static equilibrium, and the resulting peak of the Hertz pressure distribution for this peak dynamic force is 1.9 GPa (285 ksi). The Hertz pressure values stated herein are idealized stress indices assuming perfectly smooth surfaces and an even pressure distribution across a 2.79 mm (0.110 in) line contact (the line length is less than the face width allowing for the face offset and the edge break radius).

Figure 2 Measured dynamic tooth force at nominal test conditions (Ref. 22). The solid line is the
measured data, and the dashed lines are replicates of the measured data spaced along
the ordinate at the equivalent of one tooth pitch. The zones of double tooth contact (DTC)
and single tooth contact (STC) are illustrated.
The gears were tested at 10,000 rpm, which gave a pitch-line velocity of 46.5 m/s (9,154 ft/min). Inlet and outlet oil temperatures were continuously monitored. Cooled lubricant was supplied to the inlet of the gear mesh at 0.8 liter/min (49 in/min) and 320 ± 7K (116 ± 13°F). The lubricant outlet temperature was recorded and observed to have been maintained at 348 ± 4.5K (166 ± 8°F). The lubricant was circulated through a 5μm (200 μin)-rated fiberglass filter to remove wear particles. For each test, 3.8 liters (1 gal) of lubricant were used.
The tests ran continuously (24 hr/day) until a vibration detection transducer automatically stopped the rig. The transducer is located on the gearbox, adjacent to the test gears. For purposes of this work, surface fatigue failure was defined as one or more spalls, or pits, covering at least 50 percent of the width of the line contact on any one tooth. If the gear pairs operated for more than 500 hours (corresponding to 300 million stress cycles) without failure, the test at the test engineer’s discretion was usually suspended. Some superfinished gears were operated for longer than 300 million cycles. The longest test exceeded 1,000 hours (600 million cycles) without surface fatigue occurring.
Test Gears

NOTES:
1) Nominal composition per specification
2) Verified composition and within specification.
The dimensions for the test gears are given in Table 1. The gear pitch diameter was 89 mm (3.5 in) and the tooth form was a 20° involute profile modified to provide linear tip relief of 0.013 mm (0.0005 in) starting at the highest point of single tooth contact. The gears have no lead crowning, but do have a nominal 0.13 mm (0.005 in) radius edge break at the tips and sides of the teeth. The gear tooth surface finish after final grinding was specified as a maximum of 0.406 μm (16 μin) rms. Tolerances for the gear geometries were specified to meet AGMA 2000-A88 quality level class 12 (Ref. 26). Typical data from gear coordinate measurement machine inspections to verify the gear involute and lead form quality are provided in Figure 3.

NOTES:
Figure 3 Involute and lead inspection charts of a typical 28-tooth test gear. Two lead and
involute traces for both sides of teeth 1, 8, 15 and 22 are shown (NOTE: Aspect ratio of
plot is scaled as X:Y = 100:1.)
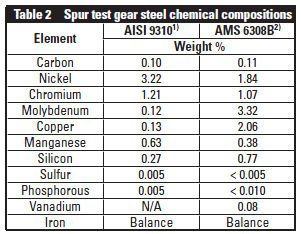
All gears included in this study were made from forged bars; the gears were made from two alloys. One alloy was per specification AISI 9310, the other per specification AMS 6308B. The chemical compositions of the two alloys are given in Table 2.
NOTE:
1) Denotes Rq calculated from published Ra values.
All of the gears made from AMS 6308B were made from a single melt of vacuum-induction melt vacuum arc re-melt (VIM-VAR) processed steel, and were manufactured as a single lot; i.e. — all rough machining, hobbing, heat treatment, and final grinding were accomplished together as a single lot of gears. The gears made from AISI 9310 steel were from two melts of steel; one melt made via air-melt vacuum-arc-remelt (VAR) process and the other melt made using a consumable electrode vacuum melt process (CVM). One can expect that the CVM-processed steels had fewer impurities than did the VAR steel. The gears made from the VAR 9310 were manufactured in one lot; those made from the CVM 9310 steel were made in three lots. Gears were case-carburized and tempered following aerospace practice to achieve a surface hardness of minimum Rc 58 — with a typical surface hardness of Rc 60 and case depth of 1.0 mm (0.040 inch). Additional details concerning the heat treatment process, typical microstructure of case and core, hardness profiles, residual stress profiles and surface metrology are available in (Refs. 13, 14, 21-22, 23 and 27).
To correlate the specific film thickness to gear fatigue lives, the surface roughness of the test gears is needed. As just mentioned, gears were made from three melts of steel. Furthermore, for one of the melts, gears were made in three lots — for a total of five manufacturing runs of gears with ground teeth. For two studies of superfinishing a lot of ground gears was divided into two groups — one group remaining in the as-ground condition and the other subjected to superfinishing. Therefore, in total there were seven groups of gears — five groups with ground surfaces and two groups with superfinished surfaces.
Superfinishing was done using one of two processes described in (Refs. 3 and 7). The surface roughness for each of the seven gear groupings was re-measured and quantified using the rootmean- squared roughness parameter (Rq). Measuring was done using a 2-μm radius, conisphere-tipped stylus profilometer, and the data were digitally processed using an ISO-conforming Gaussian roughness filter having a 0.8 mm cutoff.
The 0.8 mm cutoff is a value typically available for many surface roughness measuring instruments and software. In this work the concept of “functional filtering” was employed. The concept is that the concentrated contact acts as a mechanical filter, and therefore the wavelengths of surface roughness that influence the machine element performance depend on the breadth of the contact. Using a line-contact assumption, the gear geometry, operating torque and classical Hertz contact theory, the breadth of the Hertz contact at the pitch point was calculated as 0.47 mm — a smaller length than the 0.8 mm value of the cutoff for the digital filter. The roughness values were therefore adjusted by the method proposed by Moyer and Bahney (Ref. 28), and also recommended by the AGMA (Ref. 29) as:

- where
-
Rqeff is effective roughness parameter
-
Rq0.8 mm is roughness parameter determined using a 0.8 mm filter cut-off value
- A is contact breadth in direction of rolling, millimeters
Typical plots of surface topography of gear teeth, as measured by profilometer tracing after application of the roughness filter to the data, for three lots of the ground gears tested by Townsend and Shimski (Ref. 14), are provided (Fig. 4).

Figure 4 Examples of surface roughness data after application of roughness filter with a 0.8 mm
cutoff. The three sets are ground gears manufactured from the same melt and to same
specification, but from three different manufacturing lots.
Note that each set has a differing surface texture and roughness value.
Although not directly stated by Townsend and Shimski (Ref. 14), when they presented a correlation of fatigue data to specific film thickness, they used the maximum Rq roughness value permitted by their test gear specification to estimate the specific film thickness. So, while the correlation they provided is qualitatively consistent with the correlation to be derived herein, their correlation is quantitatively different from the present work because they did not account for differing actual roughness of test gears in their correlation, and they did not employ the concept of functional filtering.

Figure 5 Examples of surface roughness features for a gear tooth prior to and after
superfinishing, (Ref. 27): (a) ground surface; (b) same surface (relocated profile trace)
after superfinishing.
Figure 5 provides a pair of typical surface roughness data sets for the ground and superfinished gears included in this study. The measurements were made with aid of a fixture and a precisionrelocation technique (Ref. 27) such that the roughness was measured at the same position on the tooth — both before and after superfinishing. The superfinish processes removed asperity features and, as a result, only valley features of relatively small depths remained. The superfinishing resulted in a near-mirror surface quality (Fig. 6).

Figure 6 Near-mirror quality of a
superfinished test gear.
The Rqeff effective roughness parameter for each of the seven groups of gears in this study ranged from 0.07-0.45 μm (2.7- 17.9 μin). The full set of data is provided in Table 3. For sets denoted as set IDs 4-7 in Table 3, the Rq parameters were calculated from previously published Ra values using the following relationship (Ref. 27) to estimate Rq from Ra (Ref. 30):

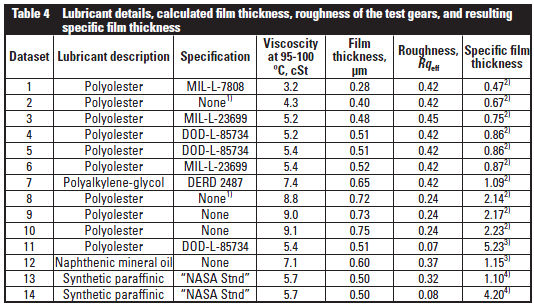
Lubricants and Specific Film Thickness
The tests considered in this study made use of twelve different lubricants. The lubricant viscosity at (95-100°C) ranged from 3.2-9.1 cSt. Most of the lubricants were fully formulated lubricants, including proprietary additive mixtures. Nine of the 12 lubricants were polyolesters; the other three lubricants were a polyalkylene- glycol, a naphthenic mineral oil, and a synthetic paraffinic. The synthetic paraffinic is termed herein as “NASA standard”-lubricant, as this lubricant has been used in the manner of a reference lubricant for many gear fatigue studies, including more than 140 tests of AISI 9310 steel gears (Ref. 22). The NASA standard lubricant includes 5% additive by volume; the additive content includes phosphorous and sulphur. For all tests the lubricants were filtered using a 5-micronrated fiberglass filter element.
The operating film thickness for each lubricant was calculated using the minimum- film-thickness equation (Ref. 31). The dimensionless (normalized) formula used was:

- where
-
U is speed parameter, proportional to the absolute viscosity of the lubricant
-
G is material parameter, proportional to the pressure-viscosity coefficient of the lubricant
-
W is load parameter, independent of the lubricant
The needed lubricant physical parameters were obtained from referenced works (Refs. 14, 22 and 23), in most cases. Some of the needed lubricant physical parameters had not been published, but were determined from laboratory records and notes of Townsend (Refs. 13-14). The lubricant physical properties are functions of temperature. For purposes of calculating film thickness, the lubricant properties used were those for the mean of the oil jet and oil outlet (drain) temperatures, i.e. — 330°K (57°C, 134°F). The minimum film thicknesses as calculated from Equation 3 ranged from 0.28- 0.75 μm (11-30 μin).
Combining the results of surface roughness evaluations (Table 3) and the minimum film thickness calculations, the specific film thickness ratio was determined for each of the 14 groups of gears that were subjected to fatigue tests. Note that the roughness value to be used for the specific film thickness calculation is the composite roughness for both gears, while the table lists the roughness for one surface. The lubricants tested and the combinations of roughness, film thickness, and resulting specific film thickness values are listed in Table 4. The range of specific film thickness for this study is (0.47-5.23).
NOTES:
1) Base stock lubricants, no additives.
2) Study #1, refers to referenced works [14, 21, 23].
3) Study #2, refers to referenced works [14, 21, 23].
4) Study #3, refers to referenced works [14, 21, 23].
5) Datasets 3, 5 and 10 were part of study #1, but the data had not been previously published.
Fatigue Test Results, Statistics, and Method for Normalizing Results
Gear fatigue tests were completed for 14 groups of gears — each group being a unique combination of alloy, surface finish roughness, and lubricant. All gears were tested on the NASA Spur Gear Test Rigs using the same torque, speed, lubricant temperatures, and test procedures. Some tests were suspended with no fatigue and no indications of pending fatigue, and so such results were treated as suspended fatigue tests. Tests that were suspended completed at least 500 test hours (300 million shaft revolutions). The longest test, one using superfinished surfaces, was suspended after 1,000 hours (600 million cycles).
All of the gear failures were surface fatigue failures. This term is used to include what is sometimes considered two separate failure modes — sub-surface spalling and near-surface, or surfaceoriginating pitting. In this work there was no attempt to determine or differentiate test results as spalling or pitting. Rather, all failures are grouped together and termed as “surface fatigue.” None of the failures were of the micropitting failure mode. A surface-fatigue life evaluation for a particular group of gears comprised multiple tests, as the scatter for such fatigue tests is significant. The number of tests completed for each group ranged from 10 to 30. The average number of tests per group — average statistical sample size — was 18. The fatigue test results for each of the 14 groups of gears were modeled as best-fit, two-parameter Weibull distributions. The parameters for the best-fit Weibull distributions were determined by median-rank regression (Ref. 32). The Weibull shape parameters (slopes) for the regression solutions ranged from 1.0-2.6. A typical Weibull plot of the gear fatigue data is provided in Figure 7. From the Weibull regression solutions, the 10 percent lives (L10) were determined for each gear group. The determined (best-fit) L10 lives ranged from 5.1-100 million cycles. The total number of tests included in this study is 258 tests.

Figure 7 Typical distribution of gear fatigue test data plotted using Weibull coordinates and
showing median-rank regression solution (solid line) and 90% confidence interval
(dashed lines).
During careful inspections of the tested gears, one notes slight differences in the widths of the running tracks. Further study would reveal that the running track widths are very consistent for all gears of a particular manufacturing lot, but the running track widths varied somewhat from lot-to-lot because of two primary factors. One factor is that the gear face widths were specified with a tolerance of ± −0.13 mm (0.005 inch). The second factor influencing the running track width is that the edge breaks vary in details from lot-to-lot — even though all are within specification. As the test torque was the same, but the running track widths varied, the load intensity for all tests was not identical. To best correlate fatigue test results to specific film thickness, the fatigue lives at common load intensity was desired.
Therefore, the fatigue lives were adjusted to account for the varying load intensity. All tests were normalized to a linecontact load intensity (load divided by Hertz line-contact width) of 580 N/mm at the pitch line. This was done with the aid of digital photographs of the tested gears recorded using a low-objectivepower microscope and small aperture setting to obtain needed resolution and depth-of-field.
The wear tracks were measured with the aid of image-processing software. The L10 fatigue lives were adjusted to estimate the results as if all tests had been operated at the same load intensity using the following relation (Ref. 33):
The load-life exponent of Equation 4 is one that was determined by tests of 9310-steel gears using the same rigs and test procedures as for the present study. One additional normalizing factor was applied to the two groups of gears made from AM-VAR melted materials, made in the 1970’s era, to be directly compared on an absolute basis to VIM-VAR processed material made approximately 30 years later. A life adjustment factor of 2.0 was applied to the L10 lives of the AM-VAR gears to estimate the experiment results if such experiments were to be repeated using VIM-VAR material (Ref. 12). With these adjustments, a set of adjusted L10 lives was determined that could, as a cohesive set, be correlated to specific film thickness. The resulting data are provided in Table 5; included in Table 5, for ease of study, are the specific film thickness data from Table 4.
Results, Correlations and Comparisons
The correlation of the gear surface fatigue lives to the specific film thicknesses were studied by a variety of plots and comparisons to other work and data presentations. Presented first is the data of the present study, plotted using log-log scales (Fig. 8). From this plot one observes features that are qualitatively consistent with the literature, namely:

Figure 8 Trend of adjusted L10 lives as a function of specific film thickness displayed using log-log
scaling; test results using base stock oils (without additives) are noted by arrows.
There is a strong correlation of surface fatigue life to the specific film thickness. Over the range of specific film thickness of this study, the correlation is nonlinear. Even with the use of log-log scales there is evidence of curvature to the correlation trend.
Gears operating near or above a specific film thickness of about two can operate for significantly longer time without surface fatigue (by a life-multiplying factor of approximately 8 ~ 10), as compared to gears operating at a specific film thickness of less than 0.8.
Also noted in Figure 8 are the two surface fatigue L10 life estimates for the gears tested using base stock oils without additives. It is interesting to note that these two data points tend toward lower bounds of the visual trend of life with specific film thickness. This perhaps points out the importance of not only the specific film thickness but also lubricant chemistry. This importance of additives is not surprising for the mixed-lubrication regime (specific film thickness ~ 0.7), but perhaps the additives and chemistry also play important roles even for lubrication regimes approaching “full lubrication.” One should keep in mind that the specific film thickness is a separation of the “mean” levels of surfaces, and a specific film of one or even two does not guarantee separations of all asperity features.
The relationship of L10 surface fatigue lives to specific film thickness can be displayed by plotting the data of Table 5 in the manner of the life factor relationship for rolling-element bearings, as recommended by STLE (Ref. 12). The resulting plot of the present study — with comparison to the practice for bearings — is provided in Figure 9. This plot uses semilog scales, matching the method of display of (Ref. 12). The gear data of this study is presented using symbols, while the STLE bearing rating life factor is presented by a line. The STLE life factor was scaled by a multiplier of 37 × 106 to provide this comparison. This scaling factor was selected to provide a “good fit by eye.” We note that the gear data largely matches the trends of the bearing life factor curve. One can judge that the speculation that the influence of specific film thickness may be greater for gear life than for bearing life (Ref. 13) is not supported by the data of this study (Fig. 9).

Figure 9 Comparison of the data of the present work using gears (data points) to life adjustment
factor correlation recommended for life ratings of bearings (Ref. 12) (solid line).
Another bearing data set that provides an interesting comparison is the data of Skurka (Ref. 34) discussed by Anderson (Ref. 35). The data are for cylindrical and tapered rolling-element bearings. These bearings have rectangular-shaped contacts like the spur gears of this study. The data plot from (Ref. 25) was scanned and the data of this study were normalized to provide the same relative life range as for the bearings, and the gear data was overlaid. The resulting plot of the combined data set (Fig. 10) has open symbols for the bearing data, closed symbols for the gear L10 data, and a trend line suggested by Skurka. The bearing and gear data are quite similar — suggesting three regimes. There is a low-specific film thickness regime with relative life near 0.3, and a high-specific film thickness regime with relative life near three. The third regime is the transition regime for specific film of about 0.8 to about 2.5.

Figure 10 Compilation of the bearing life data of Skurka (Refs. 34-35) for
cylindrical and tapered roller bearings (open symbols) and the gear
life data of this study (solid symbols).
Some guidance for estimating gear life with respect to surface durability is given in AGMA 925-A03 (Ref. 29).
In this approach, a rating factor of the allowable stress is given as a function of the lubrication regime.
Three equations are stated, each one a straight line on log-log scales but having different slopes for each of three lubrication regimes. “Boundary lubrication,” or Regime I, is defined as a specific film thickness less than 0.4. The “mixed lubrication,” or Regime II, is for specific films in the range 0.4-1.0. The “full-EHL” Regime III is slated to begin for specific films greater than 1.0. The calculations to follow allow for a comparison of the AGMA 925-A03 method to the data of this study. From Figure 8, for the largest specific film thicknesses tested (full- EHL or Regime III) the L10 lives were about 80 million. Substituting this value for cycles into the AGMA equation for Regime III, the stress factor Zn is 0.89. Now using this value for the Zn stress factor and using the equation for Regime II (mixed lubrication), one can solve for the expected life — yielding 5.6 million. From Figure 8, the experimental data for the smallest specific film value (0.47) was a life of about 9 million. Expressing life for the beginning of the mixed-lubrication regime as a percentage of the life in the full lubrication regime, the AGMA method and the data of this study yield similar percentages — seven percent and 11 percent, respectively. The present study complements the AGMA method in helping establish the quantitative relationship in the transition between the mixed- and full-lubrication regimes.
Gear surface fatigue lives are directly correlated to the specific film thickness. The trend of the gear lives as a function of specific film is nonlinear, with a dramatic increase on the order of 8 ~ 10 times longer lives for gears operating with full film lubrication, as compared to gears operating with mixed lubrication.
Summary
In this work, gear fatigue test results from previous studies were collected, studied, and assessed so as to create a single, cohesive set of 258 gear fatigue tests that together enable a quantitative correlation of specific film values to gear surface fatigue lives. The gear tests made use of 12 lubricants with viscosities ranging from 3.2-9.1 cSt. The majority of gears in this study had ground surfaces. Two gear groups tested had superfinished surfaces. All gears were made from aerospacegrade gear steels and were case-carburized. All 258 tests were completed using the same rigs, torque, speed, lubricant temperatures, and by following the same test procedures.
This study comprised 14 groups of gears that were tested for surface fatigue, each group being a unique combination of alloy, surface finish roughness, and test lubricant. For each gear group, the surface fatigue test results were used to estimate the 10 percent lives (L10 lives) by modeling the fatigue life dispersions as two-parameter Weibull distributions and fitting the data using the least-squares median rank method. The average statistical sample size was 18.
The estimated L10 lives were adjusted to account for slight differences in load intensity due to lot-to-lot variations of gear tooth face width and edge breaks. The actual load intensities were determined by measuring the running track widths from microscope photos of tested gears, and then L10 lives normalized to common load intensity. The adjusted L10 lives of the 14 test gear groups ranged from 8.7-86.8 million cycles.
Specific film values were determined using film thickness calculated by Dowson’s formula for line contacts, applying the formula to the pitch-line operating conditions. The surface roughness values used for the specific film thickness calculation were ones measured by stylus profilometer, digitally filtered using a 0.8 mm cutoff, and further adjusted using the concept of functional filtering. The specific film values for this study ranged from 0.47-5.2.
The adjusted L10 lives have a strong correlation to specific film values. The trend is one of increasing life for increasing specific film. The trend is nonlinear. The observed trends were found to be in good agreement with data and recommended practice for bearings. The L10 lives of this study in the mixed-lubrication regime were about 11 percent of the lives in the full-film-lubrication regime. This quantitative result is consistent with the relative values, as calculated by the methods of AGMA 925-A03. The specific film parameter concept has certainly been influencing the gearing practice for some time. The results obtained in this study will perhaps allow for the specific film parameter to be used with more confidence and precision to assess gear surface fatigue for purposes of design, rating, and technology development.

References
- Borsoff, V., “On the Mechanism of Gear Lubrication,” Journal of Basic Engineering, 1959.
- Patching, M., C. Kweh, H. Evans and R. W. Snidle. “Conditions for Scuffing Failure of Ground and Superfinished Steel Disks at High Sliding Speeds Using a Gas Turbine Engine Oil,” J. of Tribology, 117 (3), 482-489, 1995.
- Winkelmann, L.W., M.D. Michaud, R.W. Snidle and M.P. Alanou. “Effect of Superfinishing on Scuffing Resistance,” ASME Design Engineering Technical Conferences, DETC2003-48124, Chicago, September 3-6, 2003.
- Liou, J.J. “A Theoretical and Experimental Investigation of Roller and Gear Scuffing,” Ph.D. Dissertation, The Ohio State University, Columbus, Ohio, 2010.
- Li, S., A. Kahraman, N. Anderson and L.D. Wedeven. “A Model to Predict Scuffing Failures of a Ball-on-Disk Contact,” Tribology International, 60, 233-245, 2012.
- Brenneman, J.W. “An Experimental Study on the Scuffing Performance of High-Power Spur Gears at Elevated Oil Temperatures.” M.S. Thesis, The Ohio State University, Columbus, Ohio, 2013.
- Krantz, T., Kahraman, A., An Experimental Investigation of the Influence of the Lubricant Viscosity and Additives on Gear Wear, Tribology Transactions, 47, 138-148, 2004.
- Anderson, W., R. Parker and E. Zaretsky. “Effect of Nine Lubricants on Rolling-Contact Fatigue Life,” NASA TN D-1404, 1962.
- Anderson, W., L. Sibley and E. Zaretsky. “The Role of Elastohydrodynamic Lubrication in Rolling-Contact Fatigue,” J. of Basic Eng., 85, 1963.
- Liu, J., T. Tallian and J. McCool. “Dependence of Bearing Fatigue Life on Film Thickness to Surface Roughness Ratio,” ASLE Trans., 18 (2), 1975.
- Skurka, J., “Elastohydrodynamic Lubrication of Roller Bearings,” Trans. of the ASME, Journal of Lubrication Technology, 1970.
- Zaretsky, E.V., “STLE Life Factors for Rolling Bearings,” Society of Tribologists and Lubrication Engineers, Park Ridge, IL, 1992.
- Townsend, D. and J. Shimski. “Evaluation of Advanced Lubricants for Aircraft Applications Using Gear Surface Fatigue Tests,” NASA TM-104336, 1991.
Printed with permission of the copyright holder, the American Gear Manufacturers Association, 1001 N. Fairfax Street, Fifth Floor, Alexandria, VA 22314-1587. Statements
presented in this paper are those of the author(s) and may not represent the position or opinion of the American Gear Manufacturers Association.