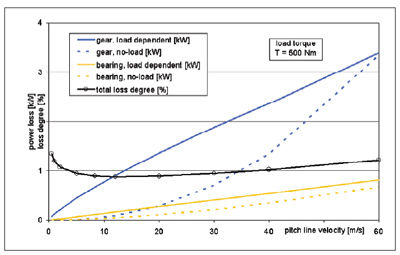
The loss degree ζ shows a significant minimum between 10 and 20 m/s rotational speed. This reflects the basic changes in the coefficient of friction in the mating gears from the mixed lubrication regime for low speeds towards elasto-hydrodynamic (EHD) friction at higher speeds. Depending on the geometry of the transmission and the operating conditions, this minimum occurs at different speed ranges.
The prevailing power loss portion is very dependent on the operating conditions. However, in order to minimize the power losses, a focus must always be set onto load-dependent gear losses since their portion is always significant. With increasing speed, no-load losses of gears need to be considered increasingly.
Basics of Load-Dependent Gear Losses
The load-dependent losses depend on both gear and lubricant properties. The calculation of load-dependent power losses in gears is based on the law of friction according to Coulomb (Ref. 3).
 (3)
(3)
 (4)
(4)
with FR friction force (measured in Newtons), µ coefficient of friction, FN normal force (measured in Newtons), PVP load-dependent power loss (measured in Watts), vg sliding speed (m/s).
Equation 4 is valid for a single point of contact. In order to receive the mean power loss of two mating gears, all points of contact along the path of contact need to be considered. The power loss is calculated by the integral of the product of sliding speed, coefficient of friction and load over the path of contact.
 (5)
(5)
with pet transverse base pitch (measured in mm), AE path of contact (measured in mm).
All three parameters (coefficient of friction, normal load, sliding speed) vary along the path of contact (Fig. 3).
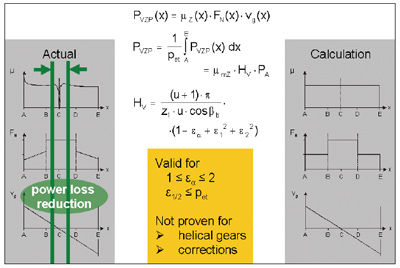
Figure 3—Tribological conditions along the path of contact.
Sliding speed is a geometry parameter that is derived from the gear shape and can be calculated exactly.
The load distribution along the path of contact can be approximately set to the total load resulting from the torque and split up into the number of pairs of teeth in contact. This assumption is a simplistic approximation (Ref. 9). The coefficient of friction over the path of contact is assumed to be approximately constant. At the pitch point C, where sliding is zero and pure rolling occurs, the instantaneous drop of the coefficient of friction to zero has to be considered. This deviation of the coefficient of friction takes place where the sliding speed is zero. Hence, in the integral, this deviation is negligible. The coefficient of friction is approximated according to the FVA project No. 166, done by Schlenk (Ref. 11), with the following equation:
 (6)
(6)
with μmZ mean coefficient of friction, Ftb circumferential force at base circle (measured in newtons), vΣC sum speed at operating pitch circle (m/s), ρredC reduced radius of curvature at pitch point (mm), ηoil dynamic oil viscosity at oil temperature (mPas), Ra arithmetic mean roughness (µm), XL factor for oil type.
With the introduced simplifications (constant coefficient of friction along the path of contact, equal load distribution onto mating pairs of teeth), Equation 4 can be applied to gears and transformed into Equation 7:
 (7)
(7)
with HV gear loss factor:
 (8)
(8)
with u = z2/z1 gear ratio, z number of teeth (1 pinion, 2 wheel gear), β<b base helix angle (°),
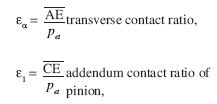

The gear loss factor HV was introduced by Ohlendorf (Ref. 9) and is only dependent on gear geometry.
These equations were set up for usual spur gear geometries (1 ≤ εα ≤ 2 and ε1/2 ≤ ρet) and produce acceptable results in these cases. Extreme gear shapes, however, may result in calculated power losses, which deviate significantly from actual power losses. By more detailed considerations, a better approximation of the real distribution of the load along the path of contact can be obtained by using sophisticated calculation methods such as FEM or the FVA-program RIKOR. This is proven by experimental investigations (Ref. 14). Gear loss factors based on such methods are called local gear loss factors HVL. Differences between HV and HVL are significant for high-contact-ratio gears, helical gears or gears with profile corrections (Fig. 4).
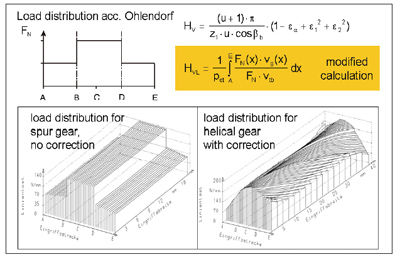
Figure 4—Gear loss factors HV and HVL.
The gear loss factors HV or HVL, respectively, comprise the integral of the product of the sliding speed and the load distribution (Refs. 9, 14). Here—for the calculation of load-dependent power losses of gears—the local gear loss factor HVL with the more realistic load distribution according to the FVA-program RIKOR is used (Ref. 10).
For gear design, power losses are often of subordinate interest, compared to load capacity and excitation level. So, if gears are to be optimized in terms of efficiency, load capacity and excitation must not be neglected. To evaluate single gear geometry parameters and their influence on power loss, load capacity and excitation are investigated by the means of FVA-programs according to Figure 5. Excitation is evaluated by the tooth force level, which represents the dynamic load in the tooth contact without respect to the further environment. This load dynamics is the cause of, but not equal to, real load dynamics, vibration and noise.
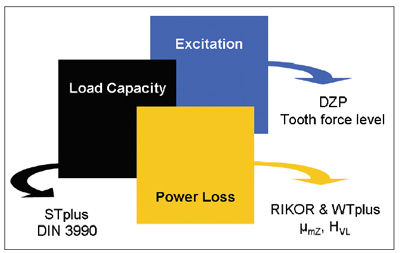
Figure 5—Calculation methods for different parameters.
Lubricant properties affect the power losses via the coefficient of friction µ and are not subject to this investigation. Their influence is supposed to be constant here.
Influence of Gearing Geometry on Load-Dependent Power Losses
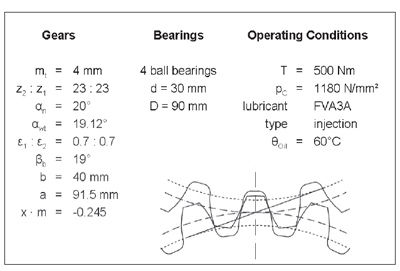
Figures 6–13 show the influences of gear geometry parameters on the gear load-dependent power losses compared to the reference gears given in Figure 1. The influence of these parameters on the coefficient of friction is included. For these parameter variations, the pitting and tooth fracture capacities are provided referring to the reference gearing with capacities of 100%. Ideally, power loss and tooth force level are low while the safety factors of load capacities are high.
The most important geometric parameters are transverse contact ratio (Fig. 6) and module size (Fig. 7). Less strong is the influence of the pressure angle, but its importance comes from the advantage that, in the given range, a higher pressure angle has only advantageous effects both on power loss reduction and higher load capacities, and no unfavorable effects on excitation (Fig. 8).
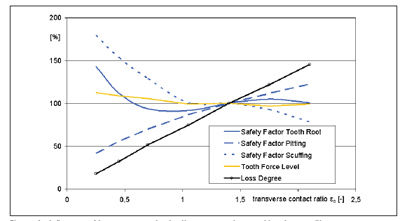
Figure 6—Influence of transverse contact ratio on power loss and load capacities.
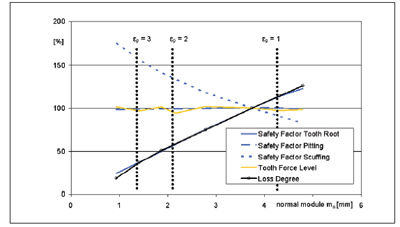
Figure 7—Influence of module on power loss and load capacities.
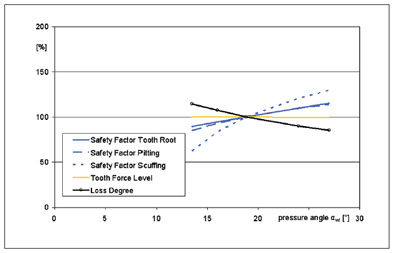
Figure 8—Influence of pressure angle on power loss and load capacities.
With helix angle, power losses increase generally but to a limited extent (Fig. 9). For minimum power losses with small transverse contact ratio, there has to be a significant overlap contact ratio (εβ > 1) for proper load capacity and noise excitation.
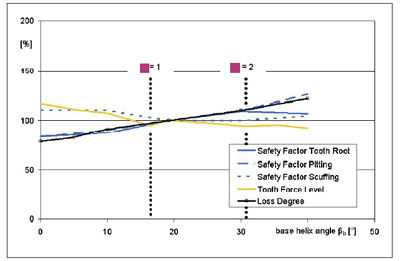
Figure 9—Influence of helix angle on power loss and load capacities.
The influence of surface roughness shows positive effects if it is reduced (Fig. 10). Unfortunately, an improvement is usually subject to cost increase. Recent investigations show that this effect is limited. Below a certain roughness, there is no further improvement. Moreover, there are other effects of surface structure such as roughness orientation, which are not expressed by surface roughness but can affect the power loss to a substantial extent.
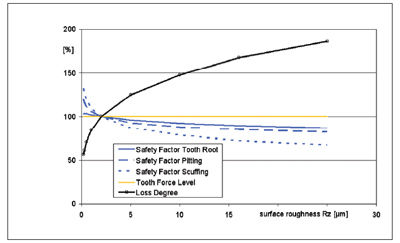
Figure 10—Influence of surface roughness on power loss and load capacities.
The gear ratio and face width parameters (at constant load per face width) are usually constraints that cannot be changed. Their effect on power loss, capacities, and excitation is shown in Figure 11 and Figure 13, respectively.
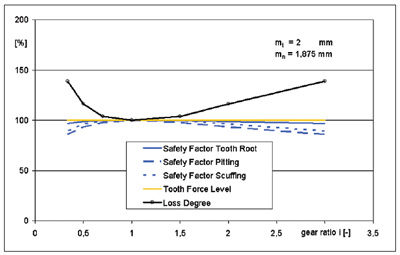
Figure 11—Influence of gear ratio on power loss and load capacities.
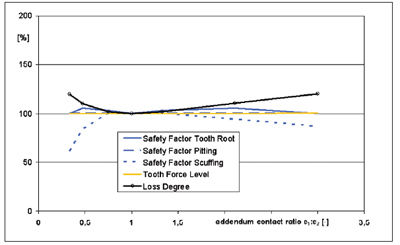
Figure 12—Influence of addendum contact ratio on power loss and load capacities.
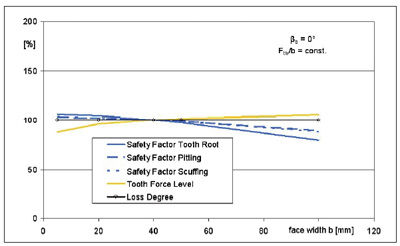
Figure 13—Influence of face width on power loss and load capacities.
Addendum transverse contact ratio is best if equally split between both gears, but small deviations have marginal impact (Fig. 12).
Gearing Optimization Process
The following steps conclude the optimization process towards low-loss gears. Most of these steps are considered unconventional, but prove more efficient to the gear design with respect to power savings. However, it is not a unidirectional process, but rather a loop that has to be run through cyclically.
- Corrections for load reduction in areas of contacts with high sliding speed
- Reduction of module down to tooth root fracture limit
- Reduction of transverse contact ratio down to pitting capacity limit
- Tooth root fillet radius as large as possible
- Increase of pressure angle
- Increase of face width
- Helix angle for adequate overlap contact ratios
Power Loss Reduction with Optimized Gearings
From the reference gearing given in Figure 1, an optimized gearing is derived. It has the same or better load capacities, but lower power losses. Figure 14 compares the absolute
figures of power loss components at one operating point (vt = 10 m/s ≈ n = 2,100 U/min; load torque 500 Nm). In this example, the bearing type has been optimized, but is not relevant here. The main changes applied encompass the following:
Bearings
- Different type (ball/taper roller)
- Size (dm = 60 mm/43.5 mm)
Gears
- Module reduction (4 mm/2 mm)
- Transverse pressure angle increase (19.1°/41.5°)
- Transverse contact ratio reduction (1.4/0.6)
- Face width increase (40 mm/80 mm)
- Overlap contact ratio increase (1.18/4.73)
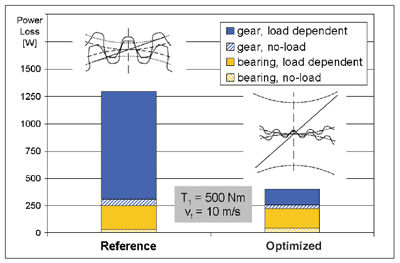
Figure 14—Comparison of power loss composition of reference and optimized gearing.
For the optimized gears, the module and the transverse contact ratio are radically cut back, compensated by a doubled face width. So, the optimized gears have a low transverse contact ratio, but a high overlap ratio for the same load-carrying capacity. Furthermore, the tooth root fillet has a larger radius in order to support the tooth root fracture capacity, and the transverse pressure angle is significantly increased for a larger radius of curvature, which backs up the pitting capacity and results in a lower coefficient of friction. Total power losses can be reduced by two-thirds in total (68.8%), where the largest portion of loss reduction is achieved for the load-dependent gear losses (see Fig. 14). The reduction of load-dependent gear losses is caused by two advantageous effects: a lower coefficient of friction because of better curvature (µm = 0.030; –32%) and lower gear loss factor (HVL = 0.045; –78%). This combination results in a reduction of load-dependent gear losses of [1– (1–0.32)*(1–0.78)] = 85%. In Figure 14, the transverse section of both the reference and the optimized gears is included.
A similar optimization procedure is applied to Type C gears, which is a frequently used test gear geometry for many kinds of gear and lubrication tests. In Figure 15, the main geometry parameters of Type C gears are given, as well as those of the corresponding low-loss gears. Additionally, the calculated safety factors are shown. Those of low-loss gears are at least equal to or even higher than those of Type C gears.
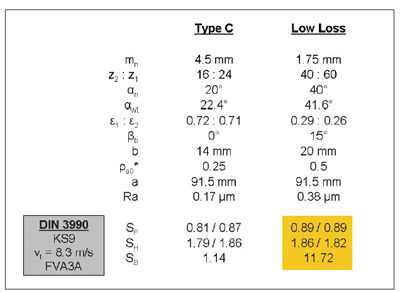
Figure 15—Gear geometry of Type C gears and corresponding low–loss gears.
Figure 16 shows experimental results of the power losses of both Type C gears and corresponding low-loss gears. Enormous power loss savings of up to two-thirds can be achieved with low-loss gears. The given percentages of power loss reduction refer to the total power loss where higher bearing losses of low-loss gears are included because of the higher pressure angle. So, the pure load-dependent gear losses are even further reduced than the numbers suggest.
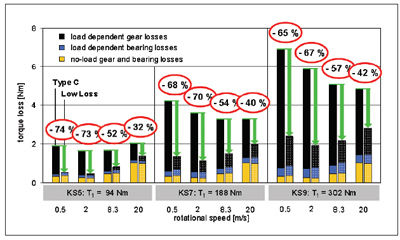
Figure 16—Experimental results of low–loss gears.
Besides power loss reduction, lower bulk and oil temperatures can also be achieved. Measurements during tests without lubrication showed a bulk temperature of 105°C for conventional gears where low-loss gears achieved 67°C. Also, its lifetime may be extended: Sample tests with coated gears—but without lubrication—showed that the coated gears had 15–20 times the load cycles of conventional gears before the coating was damaged.
Certainly, low-loss gears have some less favorable properties, including possible effects on design space and excitation level. Advantages like power loss reduction, temperature decrease and extreme lifetime extension make low-loss gears a viable option for many applications.
Conclusion
From the investigations shown in this report, the following main conclusions can be drawn:
- In a gearbox, bearing losses are subordinate to the losses in gears.
- In a gearbox, no-load losses are subordinate to the load-dependent losses at usual operating conditions. For operation at part-load or very high speeds, no-load losses may exceed the load-dependent losses.
- Load-dependent gear losses can be influenced by a range of parameters, which either affect the load distribution along the path of contact or the coefficient of friction between the mating gear flanks.
- Conventional gears can be enhanced, but their power loss reduction is limited.
- With basically changed gear geometry, which optimizes the composition and interdependencies of all gear parameters, considerable loss reduction can be achieved.
Further investigations are necessary in the fields of load-carrying capacity and noise excitation properties of unconventional low-loss gear design.
Acknowledgment
This paper contains results which were elaborated on the behalf of the sponsored project No. IPS-2001-80006 ‘Oil-free Powertrain’ of the European Union EU. Therefore, we want to thank all participating industrial associations/groupings:
- VDMA—Verband Deutscher Maschinen- und Anlagenbau, Frankfurt, Germany;
- FVA—Forschungsvereinigung Antriebstechnik, Frankfurt, Germany;
- FVV—Forschungsvereinigung Verbrennungskraftmaschinen, Frankfurt, Germany;
- FMS—Fachverband der Maschinen- und Stahlbauindustrie Österreichs, Wien, Austria;
- Magosz—National Association of Hungarian Engineering Industry, Budapest, Hungary.
- SST—Association of Manufacturers and Suppliers of Engineering Technique, Prague, Czech Republic;
- AIA—Automotive Industry Association, Prague, Czech Republic.
References
1. Doleschel, A. EDV-Programm WTplus. FVA-Forschungsheft Nr. 625, 2001.
2. Eschmann, P., L. Hasbargen and K. Weigand. R. Die Wälzlagerpraxis (Bearing Practice). Oldenbourg Verlag, München, 1978.
3. FAG. Lagerkatalog (Bearing Catalog), 1999.
4. Gesellschaft für Tribologie. Wälzlagerschmierung (Bearing Lubrication). GfT-Arbeitsblatt 3, 1993.
5. Haslinger, R., K. Salzgeber, and A. Wimmer. “Oil Free Powertrain – Work package 1.1. Analysis of Minimum Oil Requirements Considering Friction in Gears and Engines.” EU-Project No. IPS-2001-80006. Final Report, 2003.
6. INA. Nadellager, Zylinderlager (Needle and Roller Bearings), Katalog 306, 1995.
7. Mauz, W. “Hydraulische Verluste bei Tauch- und Einspritzschmierung von Zahnradgetrieben (Hydraulic Losses for Dip and Spray Lubricated Gears).” FVA-Forschungsvorhaben Nr. 44/III, Abschlussbericht, 1985.
8. Niemann, G. and H. Winter. Maschinenelement (Machine Elements). Band 2, 2. Auflage, Springer-Verlag, Berlin, 1989.
9. Ohlendorf, H. Verlustleistung und Erwärmung von Stirnrädern (Power Loss and Heat Generation in Cylindrical Gears). TH München, 1958.
10. Schinagl, S. RIKOR G, EDV-Programm zur Ermittlung der Zahnflankenkorrekturen zum Ausgleich der lastbedingten Zahnverformungen (RIKOR G, Program Code for the Evaluation of Flank Corrections to Compensate Load Dependent Tooth Deformations). FVA-Forschungsheft Nr. 481, 2000. FVA-research report no. 481, 2000.)
11. Schlenk, L. “Größeneinfluss fressen” (Size Influence on Gear Scuffing). FVA-Forschungsvorhaben Nr. 166, Abschlussbericht, 1995. FVA-research project no. 166, final report, 1995.
12. SKF. Walzlager (Anti-friction Bearings). Lagerkatalog, 1990.
13. Steingröver, K. FVA-Stirnradprogramm STplus
(FVA-program code STplus). FVA-Forschungsheft Nr. 477, 2000.
14. Wimmer, A. “Konstruktive Einflüsse auf die lastabhängigen Verluste von Verzahnungen. (Geometrical Influences on Load Dependent Losses in Gears)”. FVA-Forschungsheft Nr. 731, 2004.
Prof. Dr.-Ing. Bernd-Robert Höhn is head of the Institute of Machine Elements and the Gear Research Centre FZG at the Technical University Munich. He worked for 10 years at Audi as manager of the departments for gear research, design and experimental investigations and became a professor in 1989.
Dr.-Ing. Klaus Michaelis is research group manager at the FZG. His main working areas are load carrying capacity and experimental tribology of cylindrical, bevel and worm gears.
Dr.-Ing. Albert Wimmer was assistant at the FZG. The subject of his PhD thesis was theoretical and experimental investigation of load dependent losses in gears. He is now working with Weigl Engineering GmbH in the field of innovation management of geared systems.
 (1)
(1)


 (2)
(2)
 (3)
(3)
 (4)
(4)
 (5)
(5)

 (6)
(6)
 (7)
(7)
 (8)
(8)


