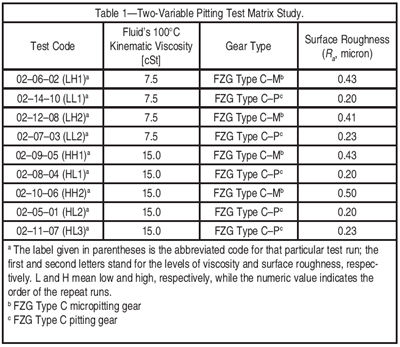
Surface analysis of the tested gears. SEM was used to analyze the wear and pits of the gear surfaces. A Form Talysurf was used to measure the deviation of the gear tooth profile from the original geometry. To find out how cracks propagate and if any subsurface nonmetallic inclusions could have initiated the cracks, tooth surfaces were sectioned where pits or spalls had occurred.
Results
SEM analysis of the tested gears. The SEM images of the tested pinion gear of each of the four matrix runs are shown in Figures 1–4. Figure 1 shows the SEM images of the No. 12 tooth of the tested pinion gear of the HL3 run at two different magnifications. The band between the upper and lower arrows is the micropitting band. As indicated in our previous paper (Ref. 3), pitting starts at the upper edge of the micropitting band.
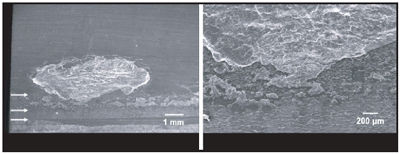
Figure 1—SEM images of the No. 12 tooth of the tested pinion gear of the HL3 run using the 15 cSt oil with an FZG Type PT-C pitting gear. The area between the two outer arrows is the micropitting band.
Figure 2 shows the SEM images of the tested pinion gear of the LL2 run. Both HL3 and LL2 runs used the same FZG Type PT-C pitting gear but with two different oils. These two oils were formulated with the same additive chemistry but different viscosity grades of PAOs to achieve two different 100°C kinematic viscosities—15 cSt versus 7.5 cSt. The micropitting band widths shown in these two figures are narrow, as is typically seen in the tested gears of FZG Type PT-C pitting gears.
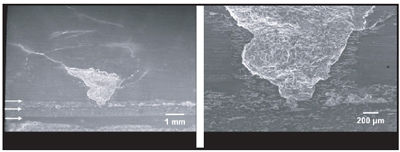
Figure 2—SEM images of the No. 5 tooth of tested pinion gear of the LL2 run using the 7.5 cSt oil with an FZG Type PT-C pitting gear. The area between the two outer arrows is the micropitting band.
Figures 3 and 4 show the tested pinion gears of the two runs HH2 and LH2, both of which used FZG Type GF-C micropitting gears. Again, the same two oils of different viscosities were used. The noticeable common feature between these two figures is the relatively larger micropitting band width.
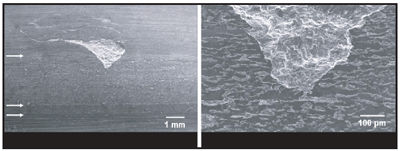
Figure 3—SEM images of the No. 2 tooth of the tested pinion gear of the HH2 run using 15 cSt oil with an FZG Type GF-C micropitting gear. The area between the two outer arrows is the micropitting band.
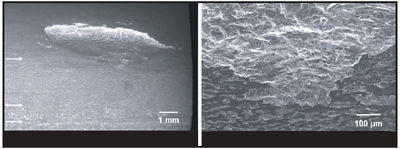
Figure 4—SEM images of the No. 10 tooth of the tested pinion gear of the LH2 run using 7.5 cSt oil with an FZG Type GF-C micropitting gear. The area between the two outer arrows is the micropitting band.
Overall, the micropitting band width appears to depend only on the type of gear used. The oil viscosity practically has no effect on the micropitting band width. However, all four sets of SEM images appear to have a common, polished wear band of approximately constant band width, which is shown between the lower two arrows. Table 2 summarizes the observations obtained from the SEM images shown in these four figures.
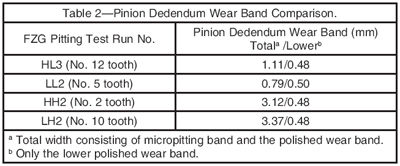
It is particularly interesting to compare the two sets of SEM images between Figures 1 and 3. The difference between the two SEM figures is that the former was obtained from a run that used an FZG Type PT-C pitting gear while the latter was taken from a run that used an FZG Type GF-C micropitting gear. Both runs used the same high viscosity oil; yet the impact on the micropitting band is quite dramatic. The run with the pitting gear had a fatigue pitting life of 42 hours, while the one with the micropitting gear had a fatigue pitting life of 170 hours.
Nevertheless, the micropitting gear accumulated a total micropitting area of 448 mm2 in just 26 hours while the pitting gear accumulated a total micropitting area of only around 224 mm2 by the time the test reached 42 hours. Similar results can be found comparing Figures 2 and 4. This time, the comparison is between two runs using the same low viscosity oil but different types of gears.
Tooth profile changes on the tested gears. To investigate why the two different types of gears produce such a large difference in the micropitting band width, we used a Form Talysurf to map the contours of the tooth profiles. Figure 5 shows the contours of the four tested pinion gear teeth, each representing one of the four matrix runs. The designation for the profile deviation of LL2’s tooth No. 5 is LL2, of HH2’s tooth No. 2 is HH2, of HL3’s tooth No. 9 is HL3 and of LH2’s tooth No. 10 is LH2.
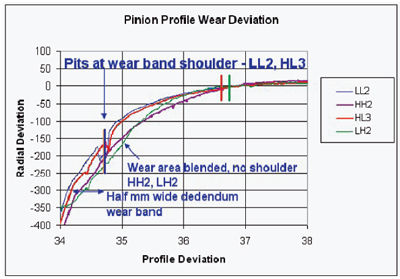
Figure 5—Wear-induced tooth profile deviation.
There are two sources for the profile deviation: one is the deviation from the ideal involute geometry even when the gear is new and the other is due to wear. For LL2 and HL3, the profile measurements went over the small pits that formed on the shoulder at the upper edge of the approximately half-millimeter wide polished wear band. The measurements for HH2 and LH2 show a greater, but more continuous and smoother wear that decreases as it approaches the pitch diameter. Intentionally, all four traces do not go through any spall to prevent damaging the instrument.
The two almost overlapping vertical bars between the 34 and 35 mm grid marks indicate the locations where the spalls start to form on the LL2 and HL3 gear teeth while the two vertical bars between the 36 and 37 mm grid marks indicate the locations where the spalls start to form on the HH2 and LH2 gear teeth. LL2 and HL3 belong to FZG Type PT-C pitting gears while HH2 and LH2 belong to FZG Type GF-C micropitting gears.
For LL2 and HL3, it is clear that the spall forms at the shoulder, which appears immediately following the lower polished wear band and can serve as a stress raiser to initiate the formation of a pit. The contours of HH2 and LH2 show that a large deviation from the original tooth profile occurs due to wear, preventing the formation of a clear shoulder. Such a large profile deviation effectively delays the buildup of a stress raiser and removes surface material that might otherwise continue to fatigue and develop into a pit.
Tooth cross sections. Figures 6 and 7 show cross sections of pitting and micropitting gears of the HL3 and HH2 runs, respectively. Figure 6 shows the cross section of a pit and the associated cracks for the HL3 pitting pinion gear with the pit initiated below the pitch diameter and continuing past the pitch diameter and into the region where the traction changes its direction. Figure 7 shows the cross section of a pit and subsurface cracks for the HH2 micropitting pinion. The starting point for the initiation of the pit in the micropitting gear is quite different from that in the pitting gear. For the micropitting pinion, the starting point for the initiation of a pit is just below the pitch diameter, with the majority of the pit lying above the pitch diameter.
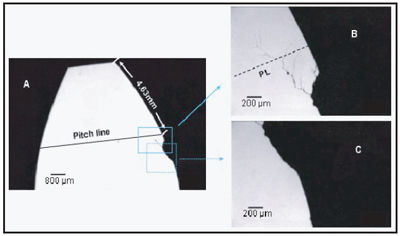
Figure 6—SEM image of a cross section through a spall on the 9th tooth of the HL3 run. This test involves a 15 cSt oil and a pitting gear.

Figure 7—SEM image of a cross section through a spall on the 2nd tooth of the HH2 run. This test involves a 15 cSt oil and a micropitting gear.
Fatigue pitting lives. The measured fatigue pitting lives obtained from the FZG pitting tests of the matrix described in Table 1 are shown in Table 3. For the runs using the micropitting gears, both values of the fatigue pitting life determined by the two different methods are listed. Table 3 also shows the EHD film thickness, boundary friction coefficients and anti-corrosion properties of the two oils used in the matrix study.
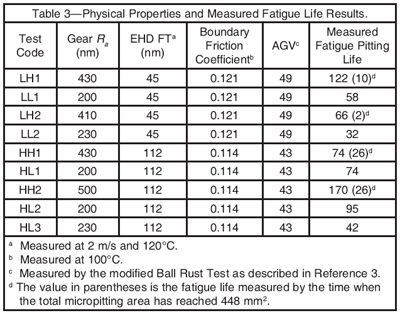
To quantify the effect of the EHD film formation, friction reduction and anti-corrosion properties of oils on the fatigue pitting life in the 120°C FZG pitting test, the physical properties of the two oils were correlated to the fatigue pitting lives obtained from the matrix study. Using multiple linear regressions with standard statistical techniques (Ref. 16), a model similar to the previous study (Ref. 3) has the following general form:
Fatigue pitting life = A + B * EHD FT + C * BndFr + D * AGV + E * Ra
(1)
The final model for fatigue life contains only those terms with a statistical significance greater than 90 percent. After the values of the constants A, B, C, D, and E are known, the relative effects of the EHD film thickness (EHD FT), boundary friction (Bnd Fr), anti-corrosion properties (AGV) and surface roughness (Ra) on the FZG rig test results are determined.
Below is the model obtained using the fatigue pitting lives determined by the conventional procedure, which measures the time when the total pitting area reaches 5 mm2.
Hours to pitting = -15.8 + 0.46 * EHD FT + 203.8 * Ra
(2)
The two parameters, boundary friction coefficient and anti-corrosion properties, AGV, are dropped from this model because the variations in these two parameters are small compared with the variations in the EHD film thickness and surface roughness. The R-square for this correlation is found to be 0.552. Not only is the R-square low, the constant found for the surface roughness is a positive value, implying that the rougher the surface, the longer the fatigue pitting life. Such results are counterintuitive.
Using the fatigue pitting lives as determined by the conventional procedure gives a poor correlation, so a second model was developed using the fatigue pitting lives determined by the alternate procedure, which measures the time for the total micropitting area to reach 448 mm2.
Hours to pitting = 69.0 + 0.49 * EHD FT - 206.4 * Ra
(3)
Again, the two parameters, boundary friction coefficient and anti-corrosion properties, AGV, are dropped from the model for the same reason as above. The R-square for this model is 0.915, which is clearly far better than the previous model. At the same time, the constant determined for the surface roughness parameter is a negative value, which implies that a rougher surface should produce a shorter fatigue pitting life. The results are in line with the expectation of the previously developed model by us using the fatigue pitting lives measured in the pitting tests employing exclusively pitting gears (Ref. 3).
Discussion
The findings of this study are not what we expected from the empirical model developed by correlating three physical properties of the oil and one physical property of the gear to FZG pitting test results carried out with the family of FZG Type PT-C pitting gears. The model predicts that gears with rougher surfaces should have shorter fatigue pitting lives (Ref. 3). Such results are in agreement with the simple theory of asperity contact in elastohydrodynamic lubrication developed by Johnson et al. (Ref. 17) based on the plasticity index concept of Greenwood and Williamson (Ref. 18).
In this study, the surface roughness of the micropitting gears (0.4–0.5 µm) is approximately two times that of the pitting gears (0.2–0.23 µm). Yet the fatigue pitting behaviors observed in these two types of gears in the FZG pitting test are dramatically different. The main differences are: 1) the micropitting band in the micropitting gears is about three times wider than that in the pitting gears, 2) the formation of pits in the micropitting gears is delayed considerably, and 3) the fatigue pitting lives determined by the standard FZG pitting test procedure do not correlate with the three physical properties of the oil and one physical property of the gear, but changing the method to measure the fatigue pitting life correlates well.
Noticing the large difference in the gear tooth profile deviation due to wear between the pitting gears and the micropitting gears, we examine the possible role of the plasticity index. Plasticity index is a measure of the probability that a material under load will undergo plastic deformation. Since plasticity indices of the driving pinions and driven gears were not measured before carrying out the pitting tests, we could only measure them after the tests. We also measured the surface roughness to compare with the values measured before the tests on the contacting sides of the teeth. The results are summarized in Table 4.
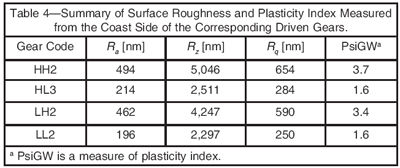
The Ra values in Table 4 closely agree with those shown in Table 1. This gives us confidence that surface roughness and plasticity index
measurements from the coast side of the driven gears are reasonably reliable. This means that the plasticity index of the micropitting gears is larger than that of the pitting gears by a factor of greater than two. However, the measured plasticity indices are larger than theoretically expected from the definition given by Greenwood and Williamson (Ref. 18), since plasticity index is proportional to the square root of Ra or Rq and inversely proportional to the square root of summit radius of the asperity, ß. Ra is the arithmetic mean of the gear tooth surfaces while Rq is the corresponding geometric mean value.
Nevertheless, plasticity indices of the micropitting gears are significantly larger than those of the pitting gears. Micropitting gears with a plasticity index at least twice as large as the pitting gears can more readily undergo micropitting wear resulting in greater gear tooth profile geometry modification and providing some stress relief.
As Figures 1–4 indicate, the micropitting wear band in the pitting gears is narrow and a shoulder is quickly built toward the edge of the micropitting wear band. With such a shoulder serving as a stress raiser, microcracks can be readily propagated to initiate a pit. This appears to be what was happening on the pitting gears. On the other hand, with a much higher plasticity index, micropitting gears can develop more extensive micropitting wear, extending the edge of the micropitting wear band all the way near the pitch line. Thus, the observed higher tooth profile deviation on the micropitting gears is understandable.
Let us then examine what happens beyond the micropitting band on the micropitting gears. Figure 7 shows that once the propagating cracks are formed, they will continue to grow in the same direction past the pitch line after which the traction direction reverses and the microcrack initiation direction also reverses. This also happens to some extent on the pitting gears, as shown in Figure 6. It is interesting to note that for the micropitting gears, once the crack for the pit is formed, it continues in the same direction beyond the pitch line, after which the traction direction is expected to reverse.
In the micropitting-initiated pitting mechanism, one expects that the direction of the crack for the formation of a pit on the dedendum should be pointing toward the pitch line while the corresponding direction of the crack on the addendum will reverse itself to point toward the pitch line again (Refs. 9 and 19). Figure 8 shows that the cracks for micropitting in the micropitting gears before and after the pitch line indeed reverse their direction as expected. In Figure 8, the solid arrows indicate the traction directions. It is possible that since the load on or near the pitch line is the highest because only a single tooth is carrying the load, the greater subsurface maximum Hertzian shear stress is responsible for continuing the pit-forming cracks.
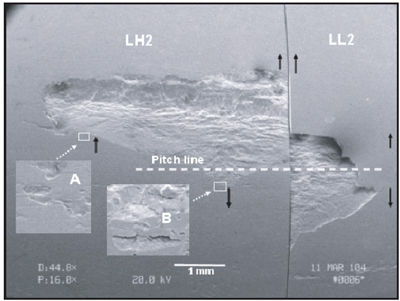
Figure 8—Micropitting crack directions before and after pitch line on the micropitting gear (LH2). The SEM was taken together from the two pinions. The location of the pitch line is defined with respect to the LH2 pinion; it is only approximate for the LL2 pinion. The magnification for the insert is 300X.
Olver offered some observations indicating that a pitting crack does not necessarily follow the microcrack-initiation direction (Ref. 20). For smoother gears, microcracks will be shorter and more difficult to propagate into spalls. Near the pitch diameter, high contact loads and the often worn geometry that increases pitch diameter stresses will likely result in subsurface origin spalls.
The observed fatigue pitting lives obtained from the micropitting gears do not correlate well with the model developed for the pitting gears (Ref. 3) nor do they agree with the simple theory of Johnson et al. (Ref. 17) when the standard definition of fatigue pitting life of the micropitting gears is used. Still, the correlation could be made to conform better to the empirical model or the theory if fatigue pitting life is defined according to the alternate method. This is shown by the model of Equation 3. Thus, the study here confirms that within the family of pitting gears, which have a surface roughness value around 0.3 mm, the rougher surface will decrease the pitting fatigue life.
The simple rule does not appear to be applicable to the family of the micropitting gears, which have a surface roughness value of 0.5 mm, because of the much higher wear rate that effectively delays the formation of a geometric stress concentration site and thus lengthens the pitting fatigue life. Even though micropitting gears show higher apparent fatigue pitting life, the rapid formation of micropitting and the associated high wear rate change the gear tooth profile so significantly, it may have weakened the tooth strength significantly early on in the test to the level that is not desirable. In other words, a high level of micropitting fatigue itself may be undesirable as much as the formation of macropitting.
Conclusions
When the FZG pitting test is carried out with FZG Type GF-C micropitting gears instead of the standard FZG Type PT-C pitting gears, the fatigue pitting lives are unexpectedly much longer than those obtained with the standard FZG Type PT-C pitting gears. The delay in the pit formation is due to extensive micropitting wear changing the gear tooth profile to prevent the formation of a shoulder that can serve as a stress raiser for the pit formation, thus suggesting that a wear model should be considered. Higher plasticity index on the micropitting gear tooth surface is responsible for extensive micropitting wear. However, if an alternate method of defining the fatigue pitting life of micropitting gears is used, then the trend of rougher surface giving shorter pitting fatigue life is followed.
This paper is republished here with the permission of the copyright holder, the American Gear Manufacturers Association, located in Alexandria, VA. The paper was presented at the AGMA 2004 Fall Technical Meeting, held Oct. 24–26, 2004, in Milwaukee, WI. Statements in this paper are those of the authors and may not represent the positions or opinions of the AGMA.
References
1. Society of Automotive Engineers (SAE) International, SAE Standard 2360, “Lubricating Oil Gear Multipurpose (Metric) Military Use,” SAE International, Warrendale, PA, April 2001.
2. ZF Friedrichshafen AG, ZFN 13026, Specification for factory fill CVT fluids, ZF Friedrichshafen AG, Friedrichshafen, Germany, April 22, 2002.
3. Li, S., M.T. Devlin, J.L. Milner, R.N. Iyer, M.R. Hoeprich, and T.M. Cameron. “Investigation of Pitting Mechanism in the FZG Pitting Test,” SAE Paper No. 2003-01-3233, 2003.
4. Anderson, N., L. Lev and G. Mordukhovich. “Pitting Fatigue in Automotive Planetary Gearsets,” JSME International Conference on Motion and Power Transmissions, MPT2001, Fukuoka, Japan, Nov. 15–17, 2001.
5. Winter, H., and T. Weiss. “Some Factors Influencing the Pitting, Micropitting (Frosted Area) and Slow Speed Wear of Surface Hardened Gears,” Journal of Mechanical Design, Vol. 103, April 1981, pp. 499–505.
6. Tanaka, S., A. Ishibashi and S. Ezoe. “Appreciable Increase in Surface Durability of Gear Pairs with Mirror-Like Finish,” Paper No. 84-DET-223, ASME, 1984, pp. 1–8.
7. Ueno, T., Y. Ariura and T. Nakanishi. “Surface Durability of Case-Carburized Gears—on a Phenomenon of ‘Gray-Staining’ of Tooth Surface,” Paper No. 80-C2/DET-27, ASME, 1980, pp. 1–8.
8. Schonnenbeck, G. “Influencing Factors on Grey Staining (Micropitting),” Proceedings of the 11th International Colloquium on Industrial and Automotive Lubrication, Technische Akademie Esslingen, Ostifildern, Germany, Jan. 13–15, 1998, pp. 425–431.
9. Hoeprich, M.R. “Analysis of Micropitting Surface Fatigue Test Gears,” Tribotest, Vol. 7, No. 4, 2001, pp. 333–347.
10. Shaw, B.A., D.A. Hofmann and J.T. Evans. “Identification of Failure Modes in Hardened Gears,” Drives and Controls Conference 1998, Telford, United Kingdom, Kamtech Publishing Ltd., pp. 23–32.
11. Shaw, B.A., and J.T. Evans. “Micropits under Microscope,” Drives and Controls Conference 1997, Telford, United Kingdom, Kamtech Publishing Ltd., pp. 36–43.
12. Hoehn, R.B., and Michaelis, K. “Test Methods for Gear Lubricants in the FZG Gear Test Rig,” Journal of the Balkan Tribological Association, Vol. 4, No. 4, 1998, pp. 221–223.
13. Kurz, Norbert. E-mail initiated by co-author Tze-Chi Jao with Kurz of ZF Friedrichshafen AG, Friedrichshafen, Germany, Dec. 17, 2003.
14. FVA Research Project N0.2/IV (July 1997 version), Forschungsvereinigung Antriebstechnik E.V., Lyoner Strasse 18, Frankfurt, Germany.
15. ZF Friedrichshafen AG, ZFN 13026, Specification for factory fill CVT fluids, ZF Friedrichshafen AG, Friedrichshafen, Germany, April 22, 2002.
16. Brownlee, K.A. Statistical Theory and Methodology in Science and Engineering, John Wiley and Sons Inc., 1960.
17. Johnson, K.L., J.A. Greenwood and S.Y. Poon. “A Simple Theory of Asperity Contact in Elastohydrodynamic Lubrication,” Wear, Vol. 19, No. 1, 1972, pp. 91–108.
18. Greenwood, J.A., and J.B.P. Williamson. “Contact of Nominally Flat Surfaces,” Proceedings of the Royal Society of London, Series A, Mathematical and Physical Sciences, Vol. 295, Issue A, 1966, pp. 300–319.
19. Antoine, F., and J.–M. Besson. “Simplified Modellization of Gear Micropitting,” Proceedings of the Institution of Mechanical Engineers, Part G: Journal of Aerospace Engineering, Vol. 216, No. 6, 2002, pp. 291–300.
20. Olver, A.V., “Micropitting and Asperity Deformation,” Developments in Numerical and Experimental Methods Applied to Tribology: Proceedings of the 10th Leeds-Lyon Symposium on Tribology, held Sept. 6–9, 1983, Butterworths, 1984, pp. 319–323.
Dr. Tze-Chi Jao is an R&D fellow and head of the fundamental research group of Afton Chemical Co., located in Richmond, VA. Afton was formerly Ethyl Petroleum Additive Co. Jao holds a doctorate in physical chemistry, and his research interests include fatigue behavior in gears, rheology, wear mechanisms in valvetrains, friction durability in transmissions, and nanotechnology. He has published more than 70 technical papers and has more than 13 patents in lubrication.
Dr. Mark T. Devlin is a senior R&D advisor with Afton, where he studies the rheological and tribological properties of lubricants. Devlin holds a doctorate in physical chemistry and has co-written more than 35 technical papers and patents. These technical publications cover a range of topics related to lubricants for use in engines, transmissions, automotive gears and industrial machinery.
Jeffrey L. Milner is a senior R & D scientist in Afton Chemical’s driveline research & development group. A chemist, he develops multifunctional gear and manual transmission lubricants for Afton Chemical for European and Asia-Pacific regions.
Dr. Ramnath N. Iyer is a senior R&D scientist with Afton Chemical and is responsible for developing additive technology for automotive transmission and hydraulic fluids. Iyer holds a doctorate in organic chemistry and has co-written several technical papers and patents related to hydraulic and automotive transmission fluids.
Michael R. Hoeprich is a technologist in the advanced product technology section of The Timken Co., located in Canton, OH. A mechanical engineer, he has performed research at Timken for 35 years. His areas of work involve failure analysis of tribological components, including gear micro- and macropitting, as well as bearing mechanics, numerical raceway contact design and stress analysis, fatigue life modeling, and effects of environmental factors on bearing life performance. He has published four papers dealing with gear contact fatigue damage.
Comment on this article by sending e-mail to publisher@geartechnology.com


