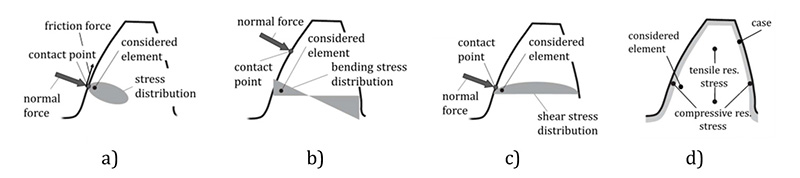
Figure 5 shows the stress components acting in a considered
element below the surface. In Figure 5a) the stress distribution
due to the normal force is shown, where the contact stress can
be described according to the Hertzian theory. The effects of the
relative sliding between the two gear flanks are considered with
the friction force. Figure 5b illustrates the bending stress distribution
over the tooth cross-section. Due to the normal force,
tensile stress is induced on the side of the loaded flank and compressive
stress on the back flank. In comparison to the bending
stress, which is nearly linear over the tooth cross-section, the
stresses due to shear load can be approximated by a parabolic distribution
with a maximum at the middle of the tooth. In Figure
5d the residual stresses are shown. As a result of the heat treatment,
compressive stresses normally occur in the case area, and
are compensated by tensile stresses in the tooth core. Unlike the
stresses in 5a, b and c, the residual stresses are load-independent
and constant over time if the load is not too high. The residual
stresses and the load induced stresses can be superimposed if the
different time dependence of the stress components is considered.
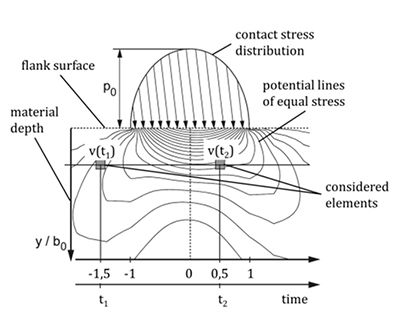
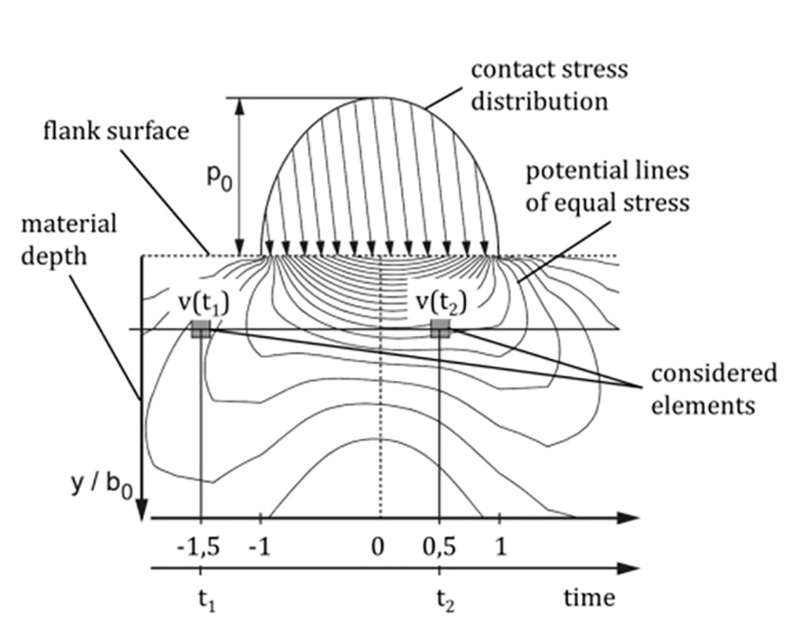
Figure 6 Time-dependent stress in the rolling contact (7).
Stress conditions in the rolling contact. On a loaded tooth
flank the rolling direction × can also be seen as the time axis. For
each considered element in the material the stress conditions
change due to the relative motion of the mating tooth flanks.
Figure 6 illustrates schematically the rolling contact with the
induced stress (one component of the 3-axis stress condition)
below the surface. Under the assumption of constant equivalent
radius of curvature and normal force, all volume elements
in the same material depth are exposed to equal stresses, but
at different times during the roll-over process. Furthermore, a
single volume element is subjected to different stresses at different
times, so when the material exposure is calculated in a
considered element below the surface, the stresses have to be
considered over the whole time axis (x-axis). However, the difficulty
in this observation is the turning of the principal coordinate
system during the rolling contact, resulting in a variation
of the absolute stress values as well as the direction of the principal
stresses for each volume element. The stress distribution
over the material depth is mainly influenced by the maximum
Hertzian pressure p0 resulting from the Hertzian contact load
and the local equivalent radius of curvature ρc. As shown in
Figure 7, the shear stress τH below the surface increases with an
increasing equivalent radius of curvature ρc — even if the maximum
contact pressure p0 and maximum shear stress τH remain
the same. Because the relative radius of curvature increases
not only with increasing center distance, but also with increasing
pressure angle or increasing addendum modification factor,
an increased shear stress τH below the surface can be expected
in these gear configurations. Furthermore, based on the fact
that the local strength profile derived from the hardness profile
remains constant, the remaining strength reserve erodes and the
risk of a crack initiation below the surface increases.
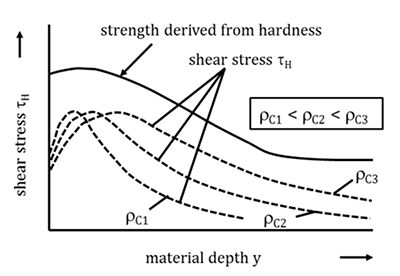
Figure 7 Influence of the equivalent radius of curvature on the shear
stress below the surface (19).
Multi-axial stress conditions are commonly described by
means of equivalent stresses. Theoretical investigations in
(Ref. 7) have shown that many of the common equivalent stress
hypotheses, such as the distortion energy hypothesis, shear
stress hypothesis and alternating shear stress hypothesis, are
not suitable for alternating stresses and stress conditions with a
rotating principal coordinate system. In (Ref. 7) various hypotheses
are discussed to their applicability for rating the material
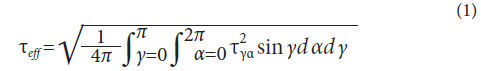
exposure in rolling contacts. In (Ref. 7) it could be shown that
the so called shear stress intensity hypothesis (SIH) is applicable
to loaded rolling contacts. The shear stress intensity τeff can be
calculated according to Equation 1; it considers all maximum
shear stresses τγα in each sectional plane γα of the considered
volume element.
Local material strength. Another decisive influence factor,
beside the stress conditions in the rolling contact, is the local
material strength limiting the load carrying capacity. Tooth
flank fracture can occur if the material strength below the surface
is exceeded. According to (Ref. 7) the material strength can
be determined based on material-physically relations where the
local strength values are calculated out of the local Vickers hardness.
An alternative, simpler method is used in (Refs. 6; 12–14;
16; 19) where the material strength is assumed to be directly
proportional to the local hardness. Further influences due to
grain size and segregation cannot be considered by the actual
state of the art.
Calculation Model
Basic formulae. A calculation model was developed at FZG to
determine the risk of tooth flank fracture. The model considers
different volume elements below the surface to determine
the local material exposure as a comparison of the local occurring
equivalent stress and the local strength that is derived from
the hardness profile. Using Equation 2, the occurring local stress
based on the equivalent stress according to the shear stress
intensity hypothesis (SIH) can be calculated:
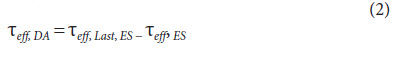
Both τeff, Last, ES and τeff, ES can be calculated using Equation 1.
However, different stress components are considered. For the calculation
of τeff, Last, ES all stress components due to external loads as
well as components due to residual stresses are used, whereas the
determination of τeff, ES is done only with the quasi-static residual stresses. Basically the decisive equivalent stress τeff, DA can be taken
as an oscillating stress with the double amplitude (Eq. 2). For the
calculation of the material exposure besides the occurring local
stress, the local strength derived from the hardness profile below
the surface is required:
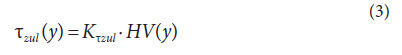
Although there is no generally valid relation between the permissible
shear strength and the local hardness, simplified it can
be assumed that the material strength, especially on case-hardened
gears, is directly proportional to the local hardness. The
factor describing the linear relation between the Vickers hardness
and material strength has a constant value of 0.4, which
was derived from gear running tests and results from industry
gearboxes. This value is valid for case-carburized gears made
of typical case-hardening steels and with adequate heat treatment.
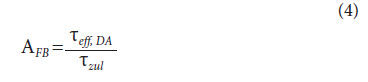
With τeff, DA and τzul the material exposure AFB for each volume
element below the surface can be determined according to
(Ref. 19) using Equation 4:
With the calculation of the material exposure AFB over the
material depth at different points from the tooth root towards
the tooth tip the risk of tooth flank fracture can be evaluated for
different mesh positions considering the local equivalent radius
of curvature, the local contact pressure and the local hardness.
The limit for the material exposure AFB, above which tooth flank
fracture should be expected, was set to 0.8. This critical value
was derived from gear running tests on test gears and recalculation
of gearboxes from different industry applications.
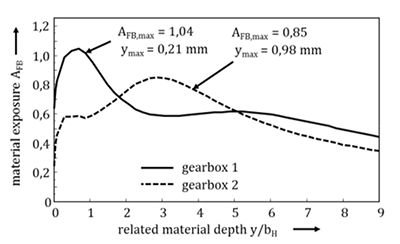
Figure 8 Comparison of the calculated material exposure curves for two
example gearboxes (19).
Figure 8 shows the comparison of two calculated material
exposure curves for two example gearboxes. The material exposure
maximum AFB, max for gearbox 1 is reached near the surface,
whereas the maximum exposure AFB, max for gearbox 2 can be
observed in greater material depth. The location of the peak is
mainly influenced by the equivalent radius of curvature, by the
occurring contact loads and by the heat treatment parameters.
Depending on the location of the maximum material exposure,
the failure type can be predicted. High material exposure values
at the surface indicate pitting whereas material exposure peaks
in greater depth can be interpreted as at high risk of tooth flank
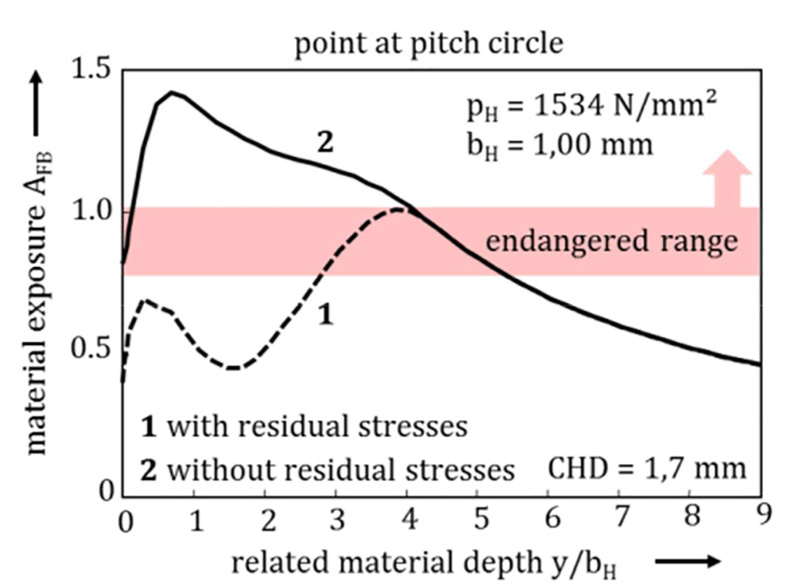
fracture. Figure 9 shows a variation calculation of the material
exposure for one contact point with and without consideration
of the compressive residual stresses near the surface. By neglecting
the compressive residual stresses in the case their positive
effect on the material exposure is lost, which always leads to a
maximal exposure close to the surface. By using the reduced calculation
model without consideration of the residual stresses the
tooth flank fracture failure, which has its initial crack in greater
material depth, cannot be reproduced. This indicates a decisive
influence of the residual stresses on the calculation results. Thus
fatigue failures due to tooth flank fracture can only be evaluated
correctly if the residual stresses are considered during the calculation.
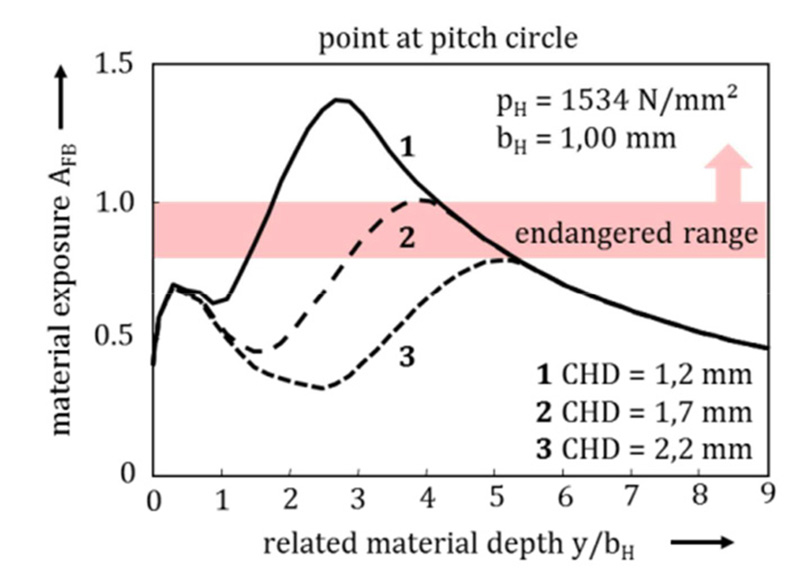
As shown in Figure 10 the reduction of the case-hardening
depth (curve 1) leads to an increase of the maximum material
exposure in greater material depth, whereas the local maximum
near the surface remains almost unchanged. Furthermore the maximum of the material exposure shifts towards
the surface. Because of the reduced CHD, the core
hardness is already achieved in smaller material depth
while the hardness near the surface remains the same.
An increase of the CHD has the effect that the maximum
value of the material exposure is decreased and
shifted towards greater depth. All three curves indicate
a strong influence of the case hardening depth
on the maximum material exposure and its location
below the surface. The local peak near the surface is
not significantly changed by the CHD variation.
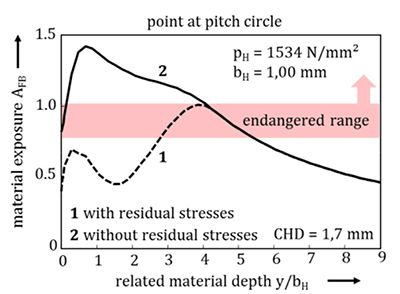
Figure 9 Material exposure curve for one contact point calculated with
and without residual stresses (19).
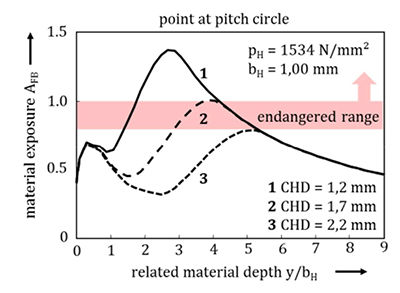
Figure 10 Influence of the CHD on the calculated material exposure (19).
The presented calculation model has the following
features and capabilities:
- Check if the maximum material exposure occurs
near the surface of the loaded flank or in greater
material depth;
- Check if the maximum material exposure is exceeded;
- Predict how deep below the surface an initial crack
may occur and consequently which type of failure
can be expected;
- Evaluate the risk of tooth flank fracture;
The most decisive influence factors that can be
optimized in order to reduce the risk of tooth flank
fracture are the gear geometry, represented by the
local equivalent radius of curvature, the gear external
loads, and the heat treatment.
Validation of the calculation model with test
results. A number of tests with test gears especially
designed to fail due to tooth flank fracture were carried
out in order to prove the applicability of the calculation
model, and to verify the critical value of 0.8
of the material exposure. On these test gears the failure
of tooth flank fracture was dominant, as it could
be reproduced repeatedly during the tests. All failed
gears had a maximum material exposure in material
depth which was higher than the limit of 0.8.
Examinations of the fracture area showed that in
almost all cases the initial crack occurred in the casecore
transition at non-metallic inclusions, such as
aluminum-oxides and/or manganese-sulfides, in an
approximate material depth between 0.8 and 1.9 mm.
Hereby, the different operating conditions and case-hardening
depths of the test gears have to be considered.
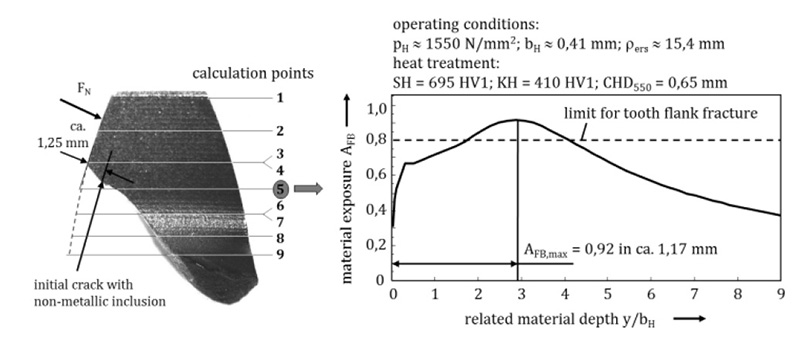
Figure 11 shows example comparison between test result
from the gear running tests and the corresponding calculated
material exposure. Because of characteristic features, the failure
could be identified as tooth flank fracture (Fig. 11, left). The initial
crack occurred at flank mid-height in a depth of ca. 1.25 mm
below the loaded flank surface, which equals nearly twice the
case hardening depth. In Figure 11, right, the calculated material
exposure curve for mesh position 5 is plotted over the material
depth. The maximum value of AFB, max = 0.92 occurring in a
depth of 1.17 mm exceeds the limit of 0.8 and therefore indicates
a significant risk of tooth flank fracture. The critical material
depth derived from the gear test was very well represented by
the calculation as well.
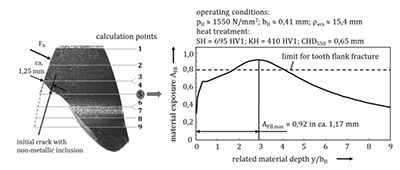
Figure 11 Comparison of test result and calculated material exposure (example for
tooth flank fracture).
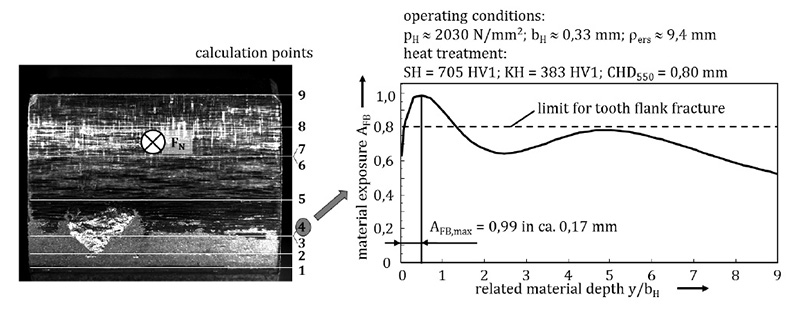
For comparison, a test gear used for pitting investigations
(mn = 5 mm, a = 91.5 mm, z1.2 = 17/18) is shown in Figure 12.
The pitting failure, as illustrated on the left, occurred during the
test run near the tooth root at mesh position 4. The maximum
material exposure of AFB, max = 0.99 in this position is found just
below the loaded flank surface, while the material exposure in
greater material depth is slightly below the limit for tooth flank
fracture of 0.8 and therefore still non-critical regarding tooth
flank fracture. Consequently a good correlation between the test
and the calculation results is present.
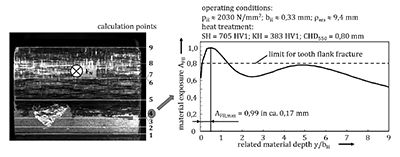
Figure 12 Comparison of test result and calculated material exposure (example for
pitting)..
Figure 13 summarizes the results from calculation studies
regarding tooth flank fracture, including gearboxes from different
applications such as wind turbines, water turbines, highspeed
gearboxes and roller mills. For all examined gearboxes
the calculated global maximal material exposure is given. The
gearboxes on the left failed due to tooth flank fracture and for
all gearboxes on the right side no damage or failures due to flank breakage were reported. A good correlation can be found
between the calculated maximum material exposures and the
observations of the different industrial gearboxes. The comparison
confirms tooth flank fracture failures when the critical value
of 0.8 of the material exposure is exceeded. All other gearboxes,
where no flank breakage occurred, lie beneath 0.8. In general a
good applicability of the calculation method could be observed.
Figure 13 Calculated maximum material exposure for different industrial
applications (19).
Conclusions
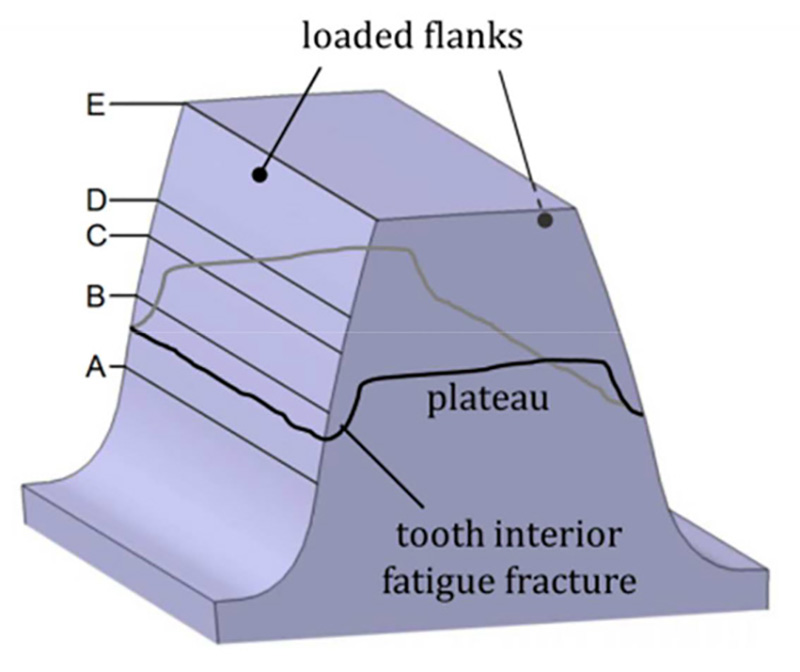
Tooth flank fracture is a sub-surface fatigue failure mode
observed on case hardened gears. One characteristic feature of
tooth flank fracture is that in comparison to pitting and tooth
root breakage, the initial crack can be found below the loaded
surface, in greater material depth. Tooth flank fracture leads
in almost all cases to the complete breakdown of the gear set.
Due to the fact that the crack is propagating inside the material,
the failure occurs spontaneously and often without any indications.
Standardized calculation methods for pitting and tooth
root breakage according to ISO 6336 do not cover this kind of
failure. Because of the different failure mechanism, systematic
investigations and the development of a new calculation method
were of a great importance. The risk of tooth flank fracture
can be described with the so called material exposure, which
is defined as a relation of the local equivalent shear stress and
the local material strength in each volume element in material
depth. One distinctive feature of tooth flank fracture is that
the crack initiation is normally located below the flank surface
in an approximate depth of the case-core transition due
to high material exposure — mostly at stress risers like nonmetallic
inclusions. With time the initiated crack propagates
bi-directionally towards the loaded flank and the tooth fillet of
the unloaded flank. When the primary crack reaches the surface,
the upper tooth part is separated within a short time due
to overload breakage. Both the crack propagation and the overload
breakage can be observed on the fracture area — typical for
tooth flank fracture. Extensive experimental investigations have
shown that the gear geometry, operating conditions, gear material
and heat treatment are the decisive factors that influence
the risk of tooth flank fracture. A new calculation method was
developed in order to calculate the material exposure below the
flank surface. It enables the evaluation of the risk of tooth flank
fracture and the optimization of the gear design considering all
important influence parameters. The validation of the new calculation
method shows good correlation with the results from
gear running tests and from industrial gear boxes. Because of
the fact that tooth flank fracture is a sub-surface fatigue failure
that can occur in any application of highly loaded case-hardened
gears, the risk should always be considered during the
gear design. The new calculation model based on the material
exposure below the surface enables the prediction of tooth flank
fracture and the optimization of the geometry, material and heat
treatment so the risk of a failure can be reduced significantly.
Although the newly developed calculation method is based on
simplified approaches and assumptions, it allows the evaluation
of the tooth flank fracture risk and stays in good correlation
with experiences from the field. Goals of future studies are the
investigation of further influence factors and their numerical
quantification.
References
- Bauer, E. “Beispiele für Verzahnungsschäden, Ausgehend von
Innenliegenden Fehlstellen,” Allianz Report 68, Heft 6, 1995, S. 230–238.
2. Bauer, E. “Flankenbrüche bei Hochleistungsgetrieben,” Allianz Report 2,
1998, S. 79-87.
- Bretl, N., T. Tobie and P. Oster. “Load Carrying Capacity of Nitrided
Gears: Mechanical Properties, Main Influencing Factors and Critical
Evaluation of the Application in Gear Transmissions,” Tagung Nitrieren und
Nitrocarburieren, Aachen, 2010.
- (4) DIN 3990: Teil 1-5, Berlin, Beuth Verlag, 1987, Tragfähigkeitsberechnung
von Stirnrädern.
- (5) DNV: Tooth Interior Fatigue Fracture for Case Hardened Gear Wheels &
Pinion, Technical Information Newsletter No. 01/2009.
6. (6) Elkholy, A. “Case Depth Requirements in Carburized Gears,” Wear 88,
1983.
- (7) Hertter, T. “Rechnerischer Festigkeitsnachweis der
Ermüdungstragfähigkeit Vergüteter und Einsatzgehärteter Zahnräder,”
Dissertation TU München, 2003.
- (8) ISO 6336: Calculation of Load Capacity of Spur and Helical Gears, Teil
1-5, Genf, 2003.
- (9) Lang, O.R. “Berechnung und Auslegung induktiv gehärteter Bauteile,”
Berichtsband zur AWT-Tagung, Induktives Randschichthärten, Darmstadt,
1989.
- Mack Aldener, M. “Tooth Interior Fatigue Fracture and Robustness of
Gears,” Dissertation KTH Stockholm, 2001.
- Oster, P. “Beanspruchung der Zahnflanken unter Bedingungen der
Elastohydrodynamik,” Dissertation, TU München, 1982.
- Pederson, R. and R.L. Rice. “Case Crushing of Carburized and Hardened
Gears,” Trans. SAE, 1961.
- Sandberg, E. “A Calcualtion Method for Sub-Surface Fatigue,” International
Symposium on Gearing and Power Transmissions, Tokyo, Volume 1, 1981.
- Sharma, V.K., D.H. Breen and G.H. Walter. “An Analytical Approach for
Establishing Case Depth Requirements in Carburized and Hardened Gears,”
Trans. of ASME, DETC, Chicago, 1977.
- Tobie, T., B.-R. Höhn and K. Stahl. “Tooth Flank Breakage — Influences on
Subsurface Initiated Fatigue Failures of Case Hardened Gears,” Proceedings of
the ASME 2013 International Design Engineering Technical Conferences and
Computers and Information in Engineering Conference, Oregon, 2013.
- Tobie, T. Zur Grübchen- und Zahnfußtragfähigkeit Einsatzgehärteter
Zahnräder, Einflüsse aus Einsatzhärtungstiefe, Wärmebehandlung und
Fertigung bei unterschiedlicher Baugröße, Dissertation, TU München, 2001.
- Wirth, C., B.-R. Höhn and C. Braykoff. “New Methods for the Calculation
of the Load Capacity of Bevel and Hypoid Gears,” AGMA Technical Paper
12FTM15, 2012.
- Witzig, J. Entwicklung eines erweiterten Berechnungsverfahrens zur
Ermittlung optimaler Zahnflankentragfähigkeit bis in den Bereich
großer Werkstofftiefen, FVA Forschungsheft Nr. 1000, Frankfurt a. M.:
Forschungsvereinigung Antriebstechnik e.V., 2011.
- Witzig, J. “Flankenbruch. Eine Grenze der Zahnradtragfähigkeit in der
Werkstofftiefe,” Dissertation TU München, 2012.