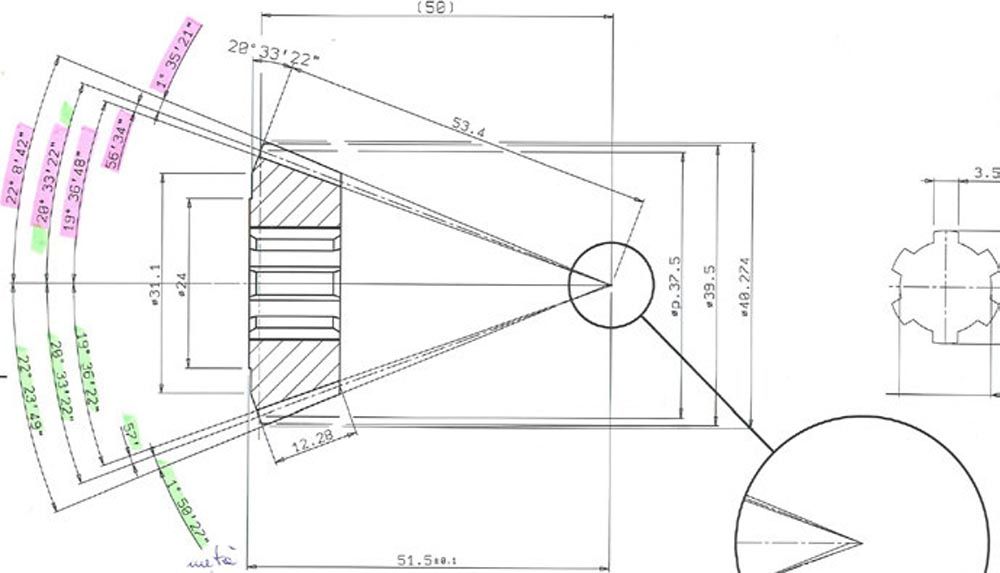
Figure 3—Drawing of a bevel gear: on the top side, there is the initial dimensioning (all apexes are in the same point). On the bottom, there are dimensions from the workshop.
In some cases, the drawing comprises two stages and keeps track of the effect of the closed loop as shown in Figure 3. The top half shows the geometry defined by the designer, while the bottom half shows the actual geometry, taken from the dimension sheet generated by the workshop.
In other cases, the same drawing of the bevel gear pair with only basic data is sent to many suppliers. Each of them cuts according to different parameters (Table 1). The same spiral gear pair is manufacturing with different geometries and so with different strength. In this case, the technical department cannot send a realistic calculation report to customers or to certification bodies.
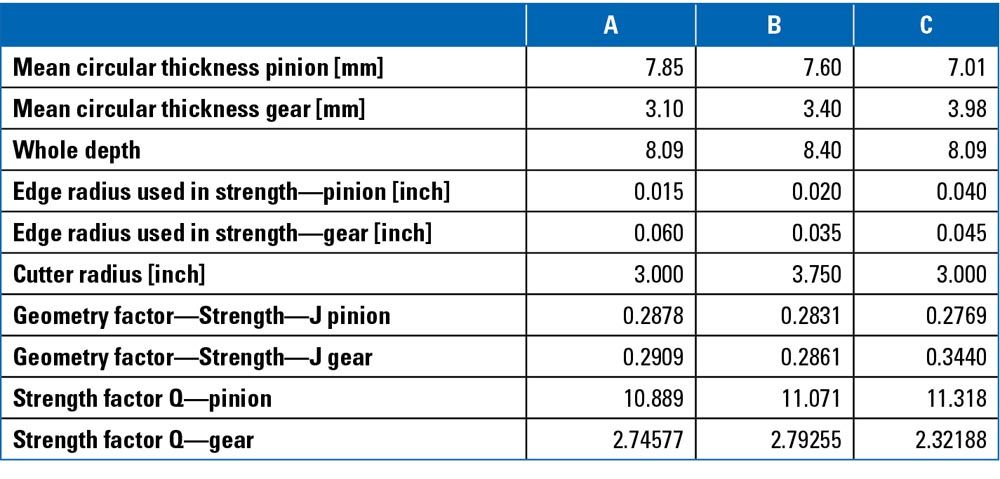
Table 1—Three different cases of Duplex Helical Spiral Bevel with the same number of teeth (13–51), module (4.126), facewidth (30 mm), and pressure angle (22.5 degrees).
This primitive closed loop for bevel gears, which limits itself to intervening in the design process prior to part manufacture, in other words to intervening exclusively in the definition of specifications, could terminate with the microgeometry grid obtained by GMM being transferred to the design software.
Cylindrical Gears
Three different case histories can be found below in relation to cylindrical gears.
Manufacturing Twist
The first case history concerns an automotive transmission. A check was requested of the contact pattern under load of spiral gears. Given the main geometry of the two gears and deflection calculated by a multibody simulation software, analysis of contact under load with various types of microgeometry was requested:
- microgeometry defined in the drawings which included both profile and flank line crowning (Figure 4);
- microgeometry estimated by design and analysis software, which adds an unwanted yet inevitable twist due to the manufacturing process, when not compensated (Ref. 10);
- microgeometry estimated by grinding machine software applying a partial compensation method (Figure 5);
- microgeometry measured by GMM (Figure 6).
The last two were fairly similar as regards the twist, but the latter clearly is more “contaminated.” In both cases, the grids could be accessed in an importable file format from the design and analysis software (Ref. 11).
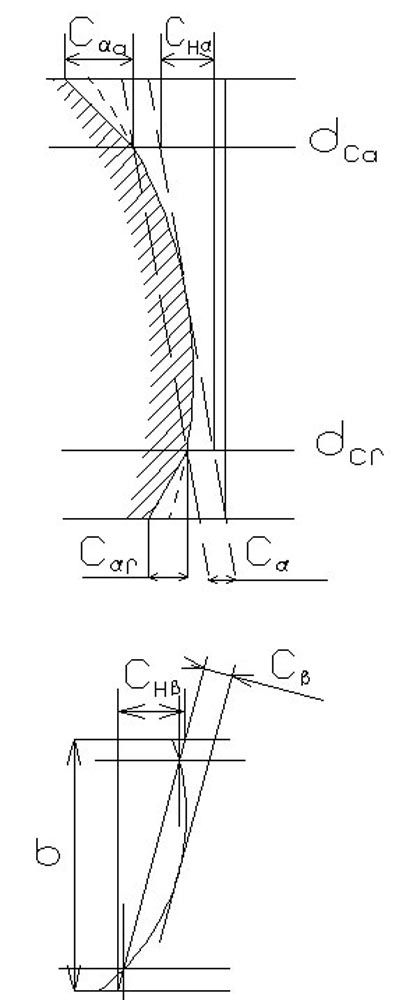
Figure 4—Profile and lead diagram not to scale, used to define micro-geometry in drawings.
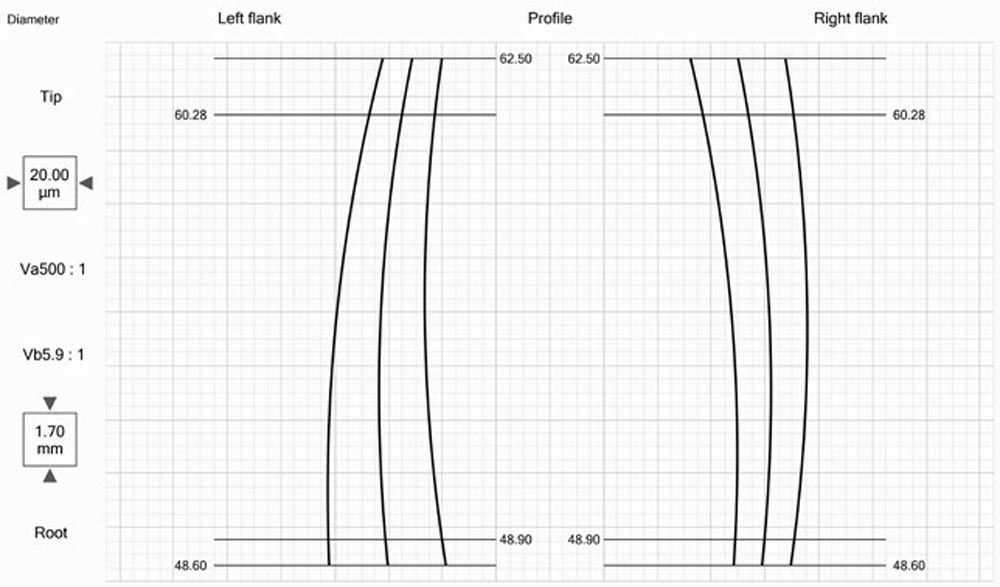
Figure 5—Profile and lead diagram, estimated by grinding control (values on axes are intentionally blank or without references).
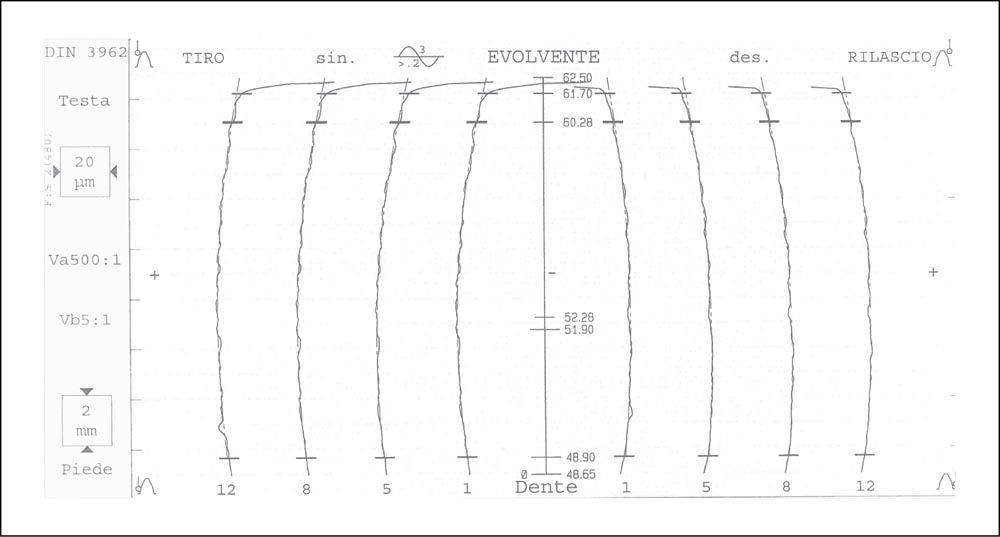
Figure 6—Profile and lead diagram, measured by GMM (values on axes are intentionally blank or without references).
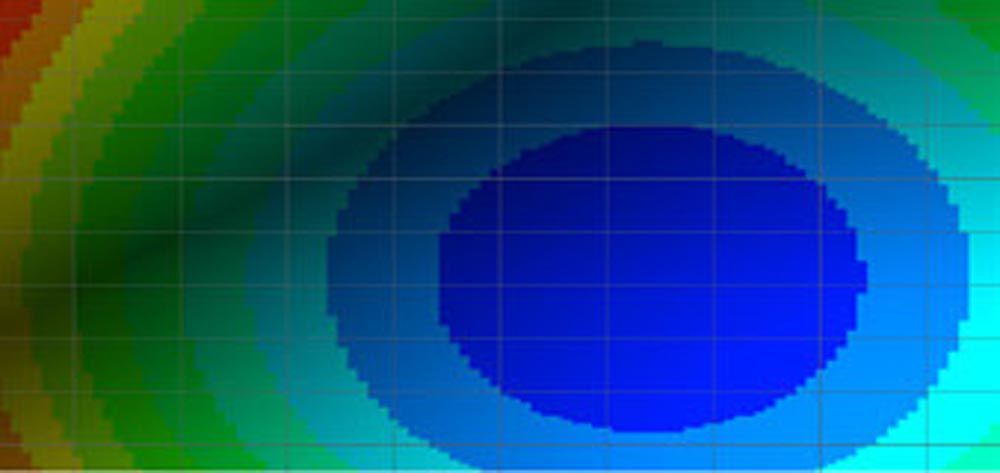
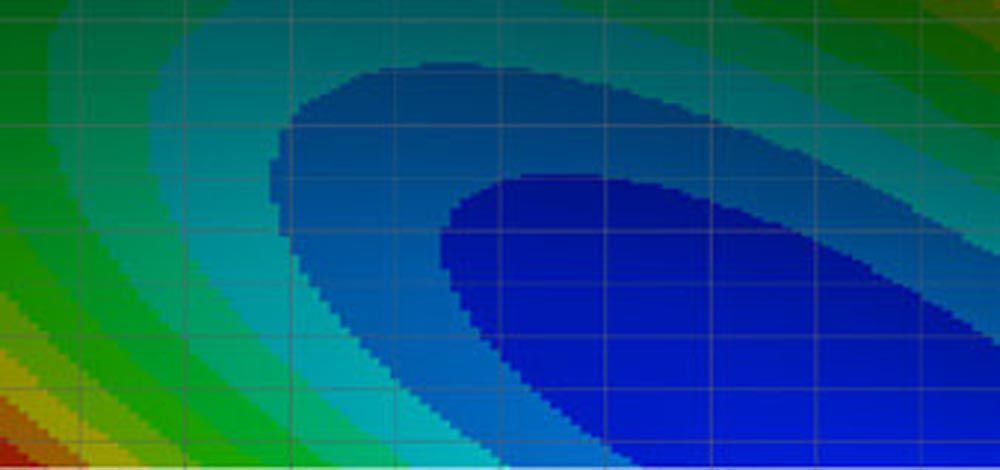
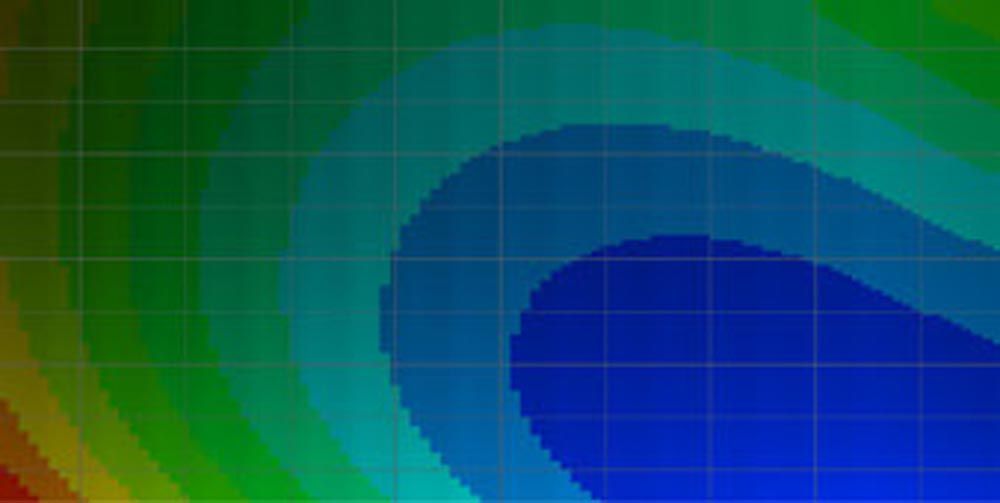
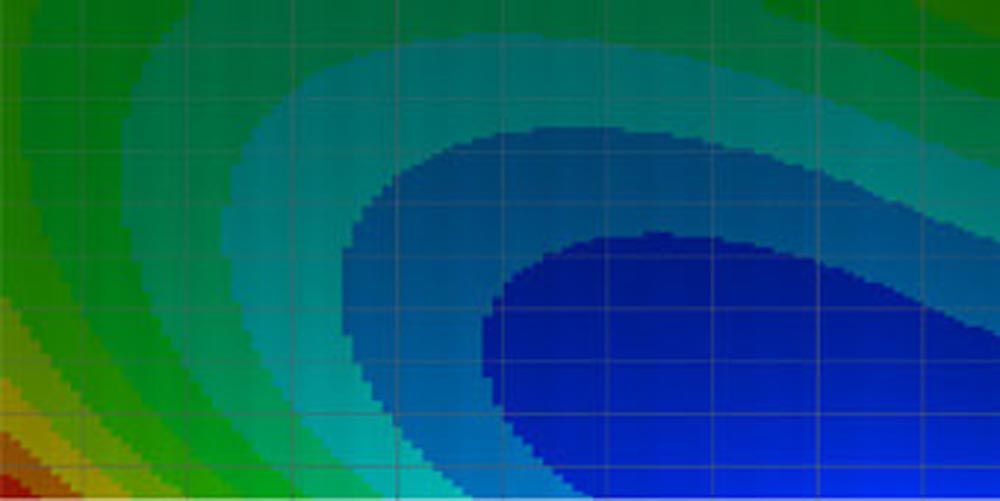
Figure 7—Some topography of the microgeometry. From top to bottom: defined in the drawing, estimated without compensation, estimated with compensation, measured (values on axes are intentionally blank or without references).
In this case, not only does the closed loop consist in being able to perform a LTCA on the measured microgeometry, but also in being able to design while taking into account the unwanted, yet clearly present, manufacturing twist.
K-chart
The second case history springs from the need to have a flexible tool to design and alter the K-profile with freedom of representation of the tolerance range. The designer needed to be able to check whether differences measured that exceeded the required tolerance were still acceptable. In this case, the technical office draws up an exemption and the design with the new tolerance area of the K-profile. These are the steps of this closed loop:
- design of cylindrical gears;
- drawings of gear, complete with K-profile with tolerance established in accordance with company specifications;
- manufacture and measurement of workpiece;
- in the event of a piece whose measurements exceed set limits, LTCA with new tolerance range;
- in the event of acceptance of results, drawing up of exemption and update of drawing with new K profile.
The tool shown in Figure 8 is an Excel worksheet, which reads formulation of the macro- and microgeometry from KISSsoft through COM interface and generates the DXF file of the K-profile for 2D drawings.
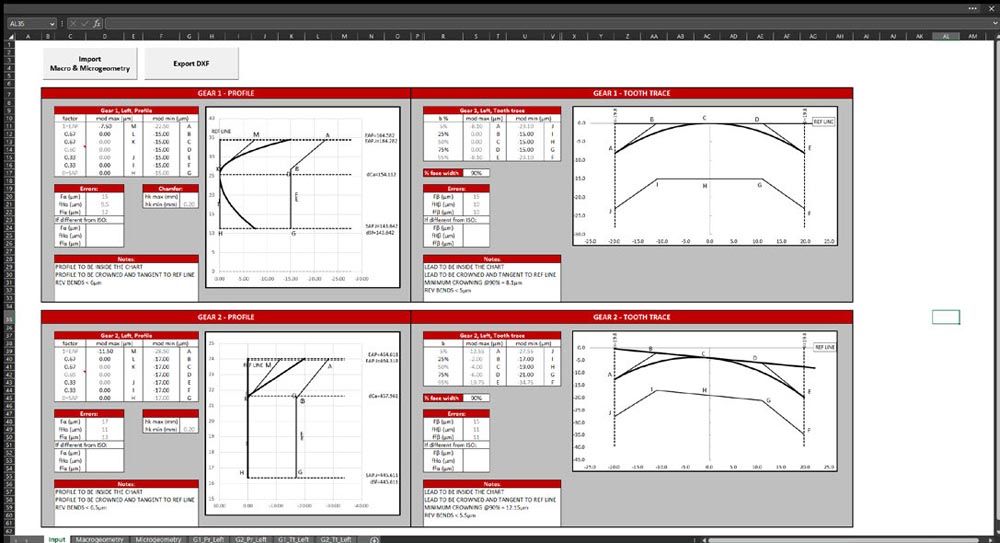
Figure 8—Excel tool to define K-chart tolerances.
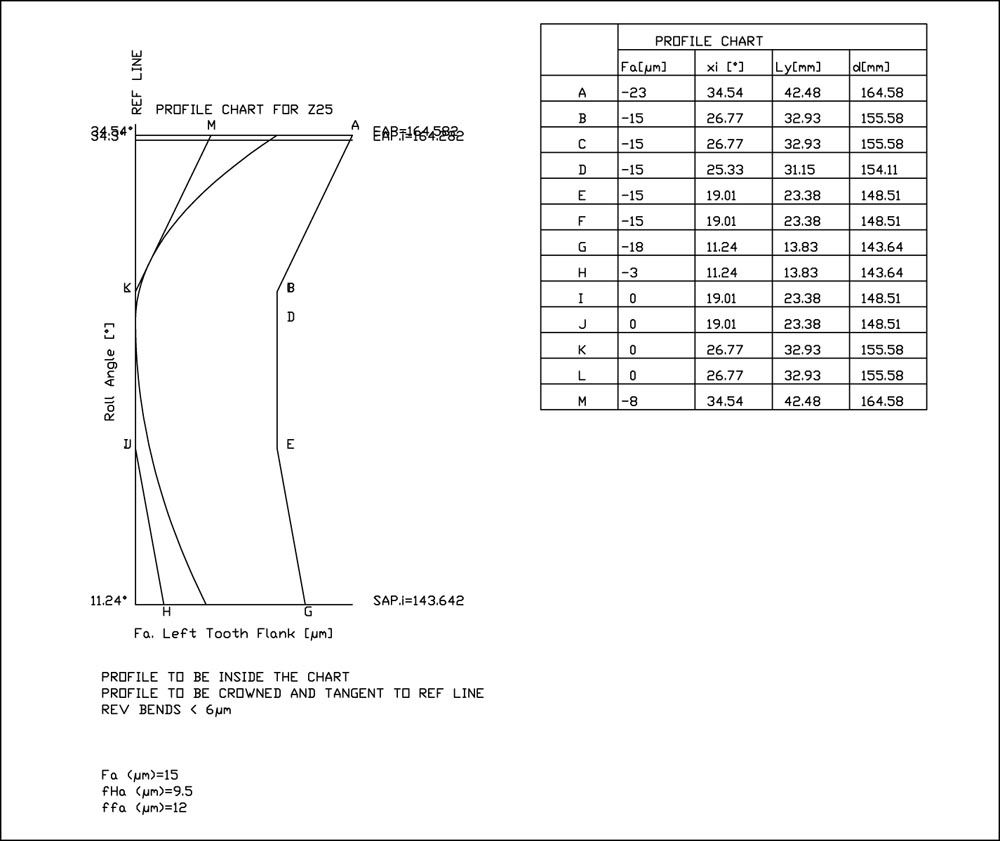
Figure 9—K-chart DXF file generated by the tool of the previous figure.
Waviness
The third case history concerns the need to limit the profile waviness (reverse bending), which some companies are showing on their drawings (Ref. 12).
A possible definition of waviness could be the distance between two peaks on involute profile measured in perpendicular direction with to the involute profile. Waviness w is measured only among peaks that are spaced at least 20 percent of the length of path of contact (Lw > 0.2 gα). The maximum acceptable waviness could be defined by a fraction of the profile error (profile form deviation) ƒfα. However, no tolerance value has been yet standardized for these values (Ref. 13).
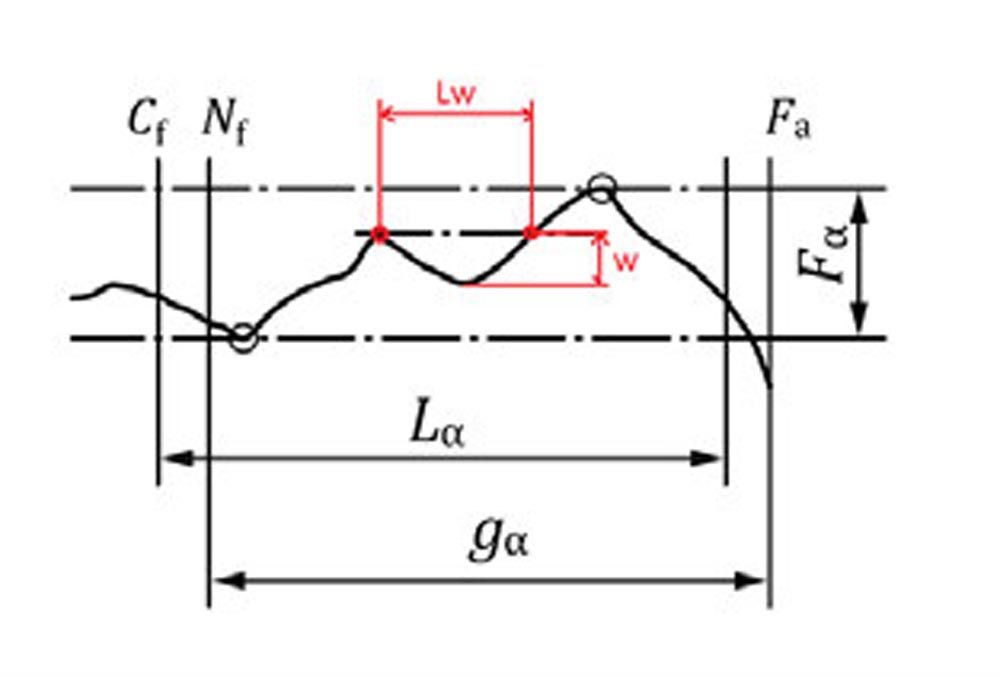
Figure 10—Waviness.
In this case, the closed loop consists of assessing the effect of the measured waviness on the transmission error.
The measured profile is then exported from GMM and imported into the design and analysis software (Figure 11). Waviness effects have been quantified with a loaded contact analysis (Figure 12). This type of analysis can be performed considering a single tooth or every tooth of the gear, using a fast GMM (Ref. 14), and a TCA software can manage different microgeometry for each tooth (Ref. 11).
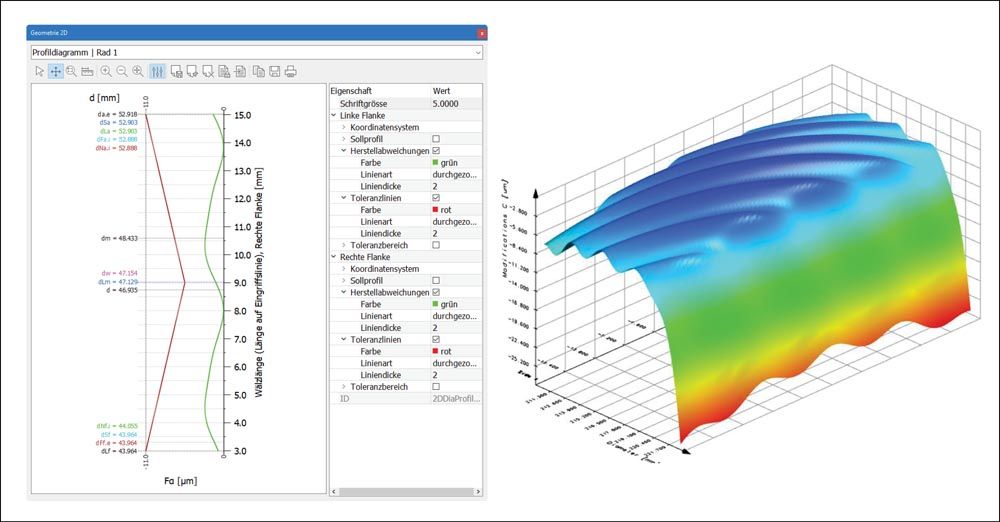
Figure 11—Measured profile with waviness imported into KISSsoft (Ref. 11).
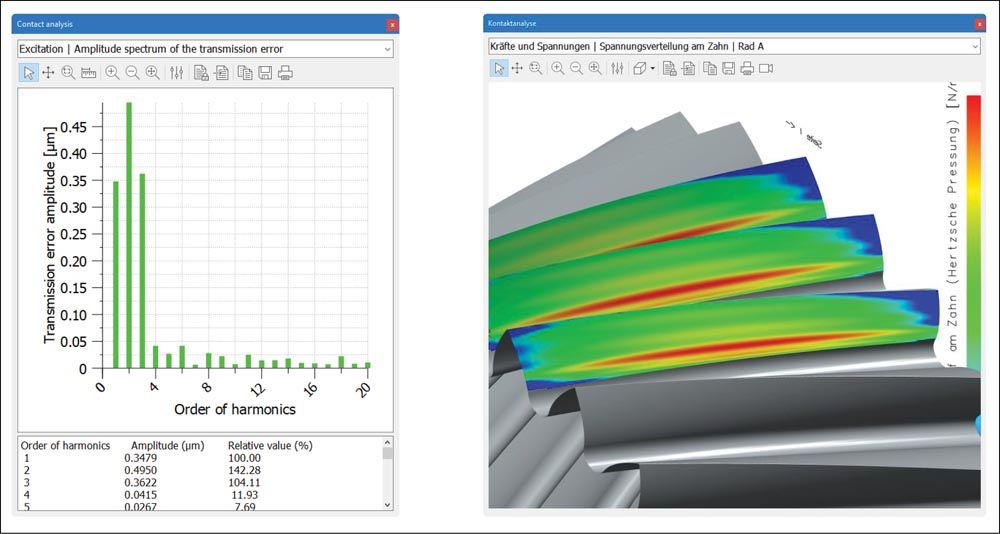
Figure 12—Results of the LTCA, considering the measured profile with waviness (Ref. 11).
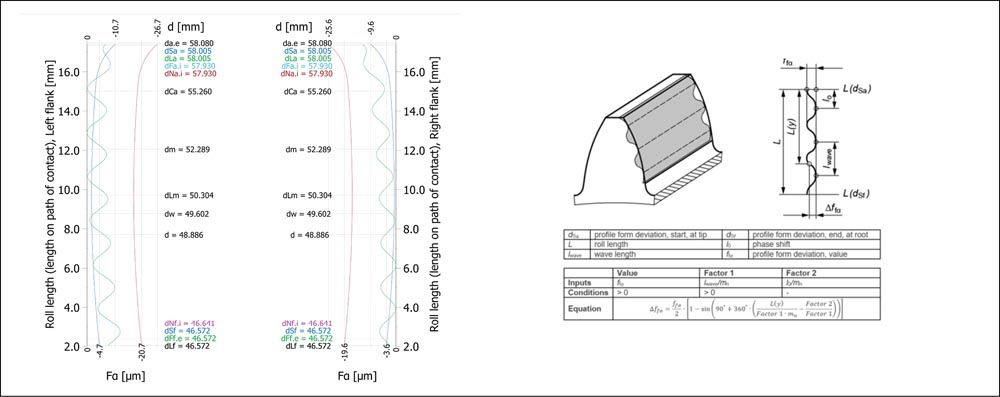
Figure 13—ƒfα modification to simulate waviness in the design process (Ref. 11).
However, before getting the measured profile form GMM, a first attempt to consider waviness during the design process could be made by adding the modification of profile form ƒfα with analytic formulation (Figure 13).
Worm Wheels
The design (specification) for worm gearboxes often lacks specific information regarding crowning, hence regarding the contact pattern under load.
Suggestions concerning what the contact pattern should be like can be found in Ref. 15, as shown in Figure 14.
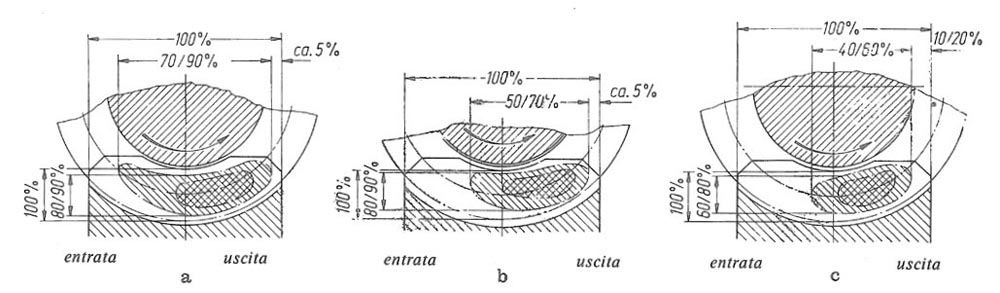
Figure 14—Proposal for the contact pattern in worm gearboxes (Ref. 15).
Generally speaking, crowning is obtained by oversizing the hobbing tool with regard to the worm dimensions (Refs. 16, 17) and by tilting it in relation to the worm’s axis, at a clearly increased center distance.
Unlike cylindrical gears, whose microgeometrical adjustments are usually obtained during grinding, with specifically dressable tools, worm wheels, in bronze or cast iron, are finished by the hobbing. So the cutter’s resharpening and changing the tool diameter also changes the contact pattern in the worm wheel.
These conditions must be complied with in order for meshing requisites to be met (Ref. 18).

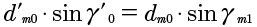 (1)
(1)

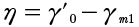 (2)
(2)

 (3)
(3)
where

 is the worm reference diameter

 is the reference lead angle of worm

 is the oversized hobber reference diameter

 is the oversized hobber reference lead angle

 is the hobber reference diameter after resharpening

 is the hobber reference lead angle after resharpening

 is the backing angle of the hobber
Some companies have recently adopted the closed loop for worm screw crowns by following the steps listed below:
- design of the worm gearbox (worm and worm wheel) providing for an oversize of the crown cutter (Figure 15);
- numerical and graphical check of contact pattern (Figure 16);
- generation of “hobber tip diameter | backing angle of the hobber | cutting center distance” table, taking into account that the hobber tip diameter decreases when resharpened (Table 2);
- exporting of grid for GMM without taking into account cutter oversize (digital master) (Figure 17);
- cutting as per listed parameters;
- measurement on GMM and comparison with digital master (Figure 18).
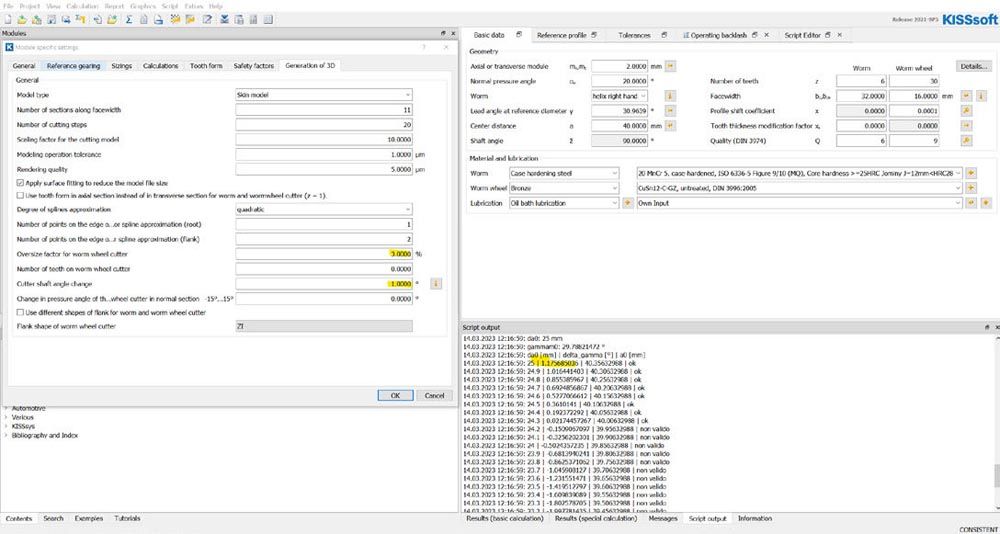
Figure 15—Design of the system worm and worm wheel with oversized hobber (Ref. 11).
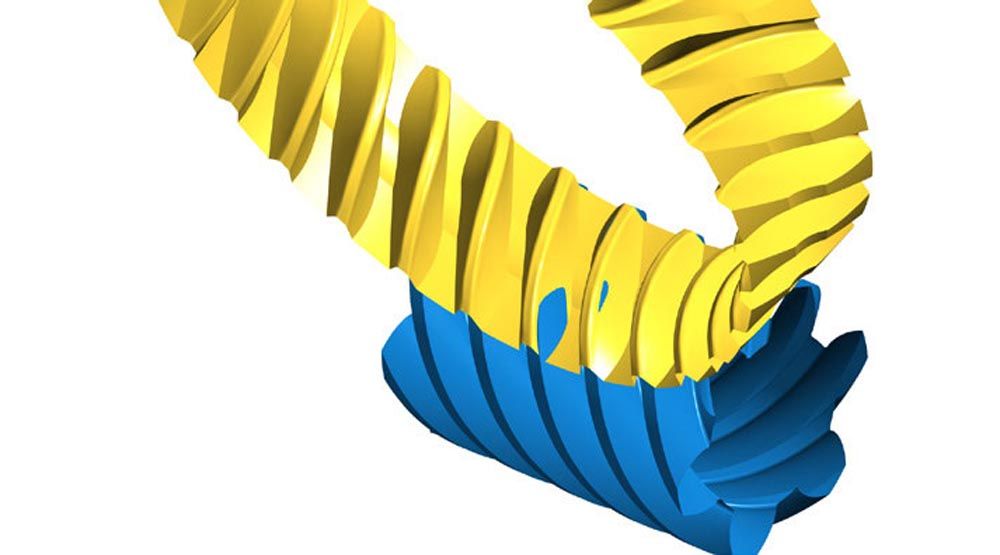
Figure 16—Check of the contact pattern on the design software (Ref. 11).
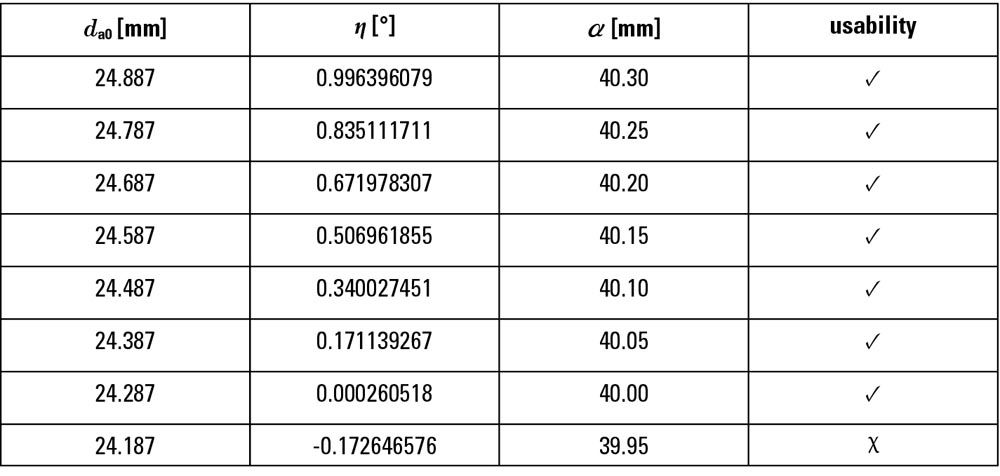
Table 2—Backing angle of the hobber and manufacturing center distance vs. resharpened hobber tip diameter.
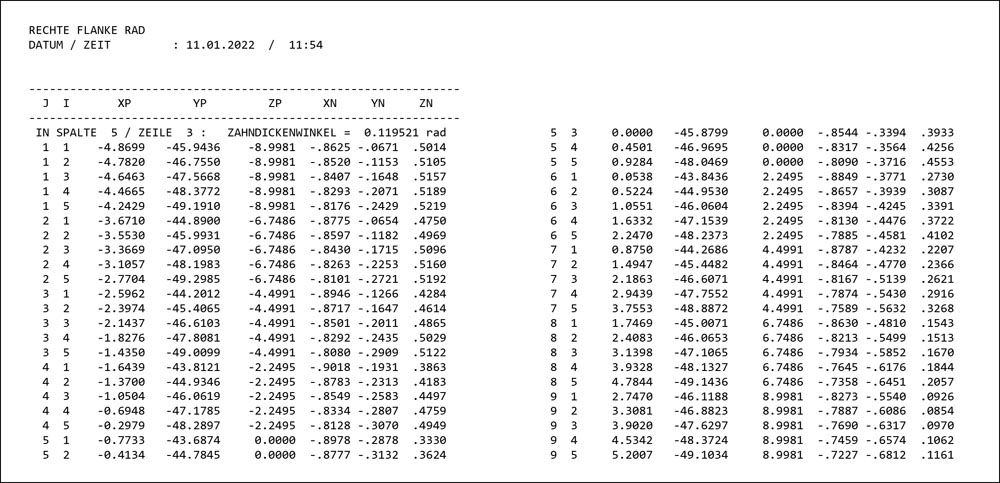
Figure 17—Grid exported by the design software.
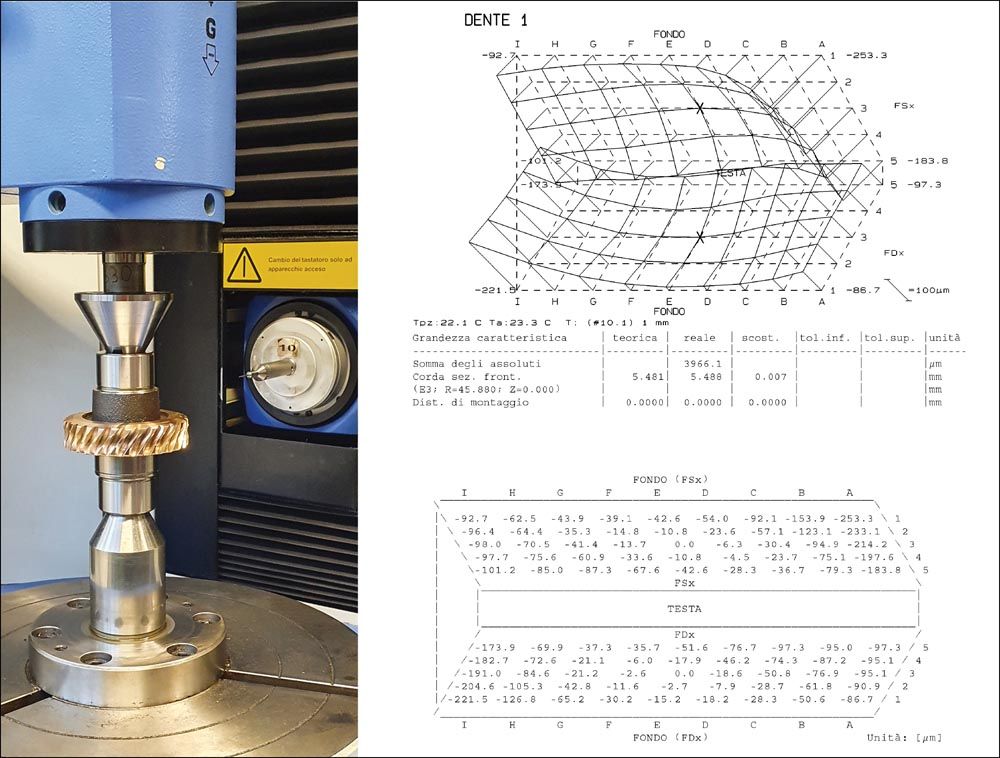
Figure 18—GMM measurement (A) and report (B).
The first result to check in the GMM report is the tooth thickness (chordal in transverse section): this is what makes it possible to keep a check on gearing backlash. Single-flank gear inspection was performed prior to adopting this procedure.
Figure 18B shows crowning until the tool reaches the end of its life. Crowning disappears at the precise moment when the tool takes on the worm’s dimensions.
The operator has the same software in the workshop as used during design and can generate the grid (digital master) that takes into account the actual dimensions of the cutter that cut the wheel it is measuring. In this case, the drawing will not show crowning, but only any errors.
Conclusions
The goal of this paper was to help the reader improve the documentation and performance of bevel, cylindrical and worm gears. The closed loop is an improvement in the manufacturing process of gears, which connects design and production in a two-way manner. A necessary condition for its adoption is an awareness that specification and verification must also be connected. You cannot request what you cannot measure. The measurement process must be defined in a clear, unambiguous way, just as the measurements to be taken already are.
Acknowledgments
The author wishes to thank KISSsoft and Gleason for the software. Thanks also to the companies Bonfiglioli, Comer, CNH, Gildemeister, Stellantis and Varvel—Mechnology that adopted the closed loop described in this paper.

Bibliography
- Kagermann, H., Lukas, W.-D., and Wahlster, W., 2011, “Industrie 4.0: Mit dem Internet der Dinge auf dem Weg zur 4. industriellen Revolution—ingenieur.de,” ingenieur.de—Jobbörse und Nachrichtenportal für Ingenieure [Online]. Available: ingenieur.de/technik/fachbereiche/produktion/industrie-40-mit-internet-dinge-weg-4-industriellen-revolution/. [Accessed: May 13, 2022].
- ISO 1:2016, Geometrical Product Specifications (GPS)—Standard Reference Temperature for the Specification of Geometrical and Dimensional Properties.
- Deni, M., 2013, “Gear Standards and ISO GPS,” Gear Technology, pp. 54–57.
- Turci, M., 2021, “Integrated Optimization of Gear Design and Manufacturing,” Fall Technical Meeting (FTM), AGMA, Chicago.
- Brown, J., 2000, “Closed-Loop Gear Manufacturing System Speeds Design to Manufacturing,” Machine Design.
- Brumm, M., 2018, “Closed Loop Machining of Cylindrical Gears,” Gear Solutions.
- 2021, “GEMS—Gleason Engineering and Manufacturing System”.
- Plato, Apology.
- Shigley, J. E., and Mischke, C. R., eds., 1996, Standard Handbook of Machine Design, McGraw-Hill, New York.
- Kissling, U., Stolz, U., and Turich, A., 2019, “Combining Gear Design with Manufacturing Process Decisions,” pp. 1533–1544.
- “KISSsoft Calculation Program”.
- Frazer, R. C., Koulin, G., Reavie, T., Wilson, S. J., Zhang, J., and Shaw, B. A., 201AD, “The Application of Geometrical Product Specification (GPS)—Compatible Strategies for Measurement of Involute Gears,” Gear Technology, pp. 73–78.
- VDI/VDE 2612-1:2018, 2018, Measurement and Testing of Gears.
- Türich, A., 2022, “Gear Hard Finishing with up to 100% In-Process Inspection,” VDI-Berichte Nr. 2389, 2022, VDI Verlag GmbH, Düsseldorf.
- Niemann, G., and Winter, H., 1986, Elementi di Macchine, Vol. 3, Edizioni di scienza e tecnica; Springer, Milano; Berlin.
- Kohara Gear Industry, Gear Technical Reference.
- Crosher, W. P., 2002, Design and Application of the Worm Gear, ASME Press, New York.
- Dudás, I., 2000, The Theory and Practice of Worm Gear Drives, Penton Press, London.