As the different characteristics represent different aspects of the cutting conditions, the relationship between individual simulation results and cutting phenomena is investigated. Based on the underlying principle, corrective measures are deduced.
Finally, the tool and process data are adapted for the sample gearset according to the findings. The optimized design is simulated again by means of BevelCut. The simulation results verify and quantify the effect of the changes.
Manufacturing Simulation BevelCut
The manufacturing simulation BevelCut has been developed at the Laboratory for Machine Tools and Production Engineering (WZL) of RWTH Aachen University and has been applied mainly to analyze face milling rolling and plunging processes in the past (Refs 3, 12). Due to recent innovations, the program’s scope has extended to face hobbing rolling and plunging processes as well (Ref. 8). The planar penetration calculation as the underlying principle, however, remains the same for all process methods and is illustrated in Figure 2.
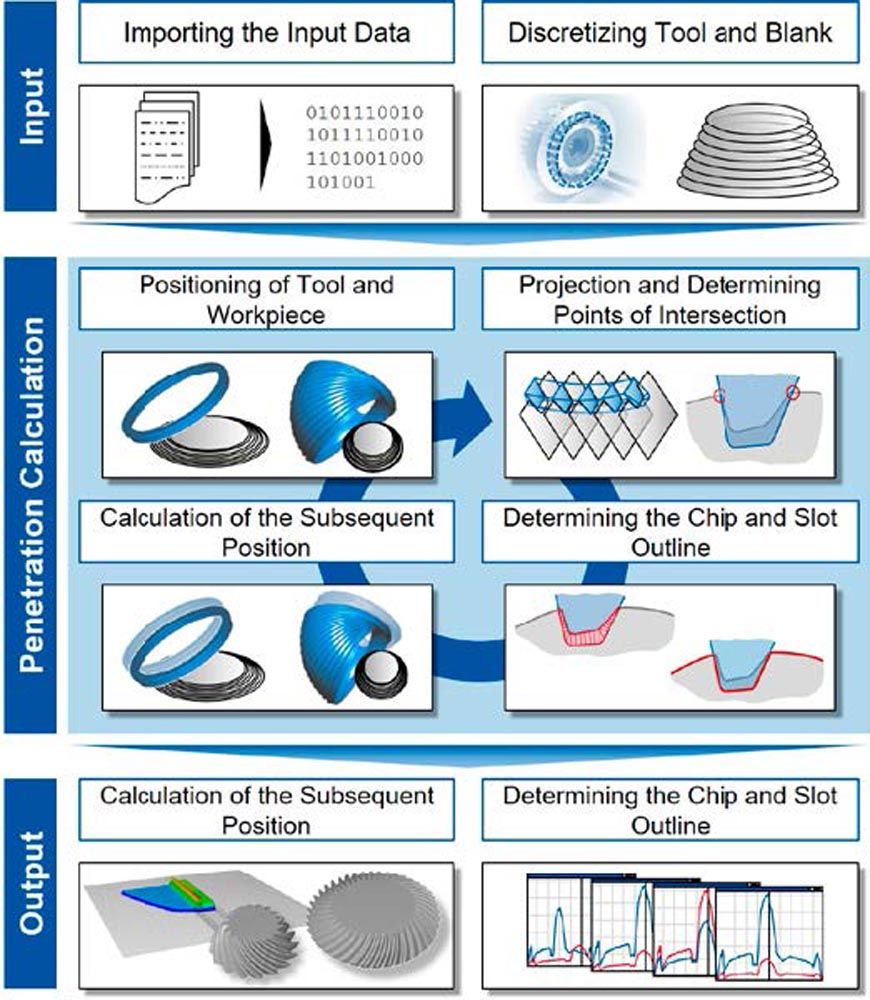 Figure 2—Mode of operation of the manufacturing simulation BevelCut.
After importing all necessary data from the design software, the workpiece blank represented by a bevel frustum is discretized along its rotational axis. As a result, the blank is represented by circular planes of differing diameters. The tool is discretized along its cutting path. The resulting enveloping body includes the tool geometry as well as the machine and process kinematics (Ref. 3, 12).
The core of the penetration calculation consists of four steps. First, the tool and workpiece need to be positioned correctly according to the regarded moment in time. Subsequently, the tool profile is projected onto the individual planes, and the intersections between the workpiece and the projected tool outline are determined. With the help of these intersecting points, the chip outline can be determined and thus, the new slot outline. This information is stored and as a next step, the tool and workpiece are repositioned again. These four steps are repeated until the end of the process has been reached (Refs. 3, 12).
The resulting workpiece geometry as well as all information on the undeformed, 3D chip geometry are evaluated as part of post-processing. For every cut that occurred throughout the process, the chip thickness hcu can be evaluated along the unrolled profile edge as a maximum hcu,max or mean hcu,mean value. The chip thickness hcu represents the load of material a point on the profile edge has to the machine. Similarly, every point of the unrolled profile edge can also be attributed to a chip length lcu. The chip length lcu indicates how long the tool and workpiece are in contact and thus, is an indicator of friction and heat within the process. The machined area Acu combines the chip thickness with the length of the chip. These values are available for every chip cut at every point in time by every blade. To condense the information further, the maximum and mean chip thickness can also be evaluated for the entire process. Based on this information, the number of cuts Ncu each point on the profile edge contributes to throughout the process can be determined. By analyzing the number of cuts Ncu, the influence of the pulsating load on the blade’s fatigue life can be determined (Refs. 3, 12).
Currently, the manufacturing simulation BevelCut can simulate both face hobbing and face milling processes. Straight plunging and single-generating methods are implemented as well. Therefore, every combination common in the industry is represented. The standard blade profile as well as all blade modifications such as profile crowning, tip relief, and root relief as well as their combinations allows for reproducing every possible gear design.
Simulation Results
The simulation was performed for a gearset of an automotive application. For this example, neither gear design nor process was optimized. The input data is shown in Table 1.
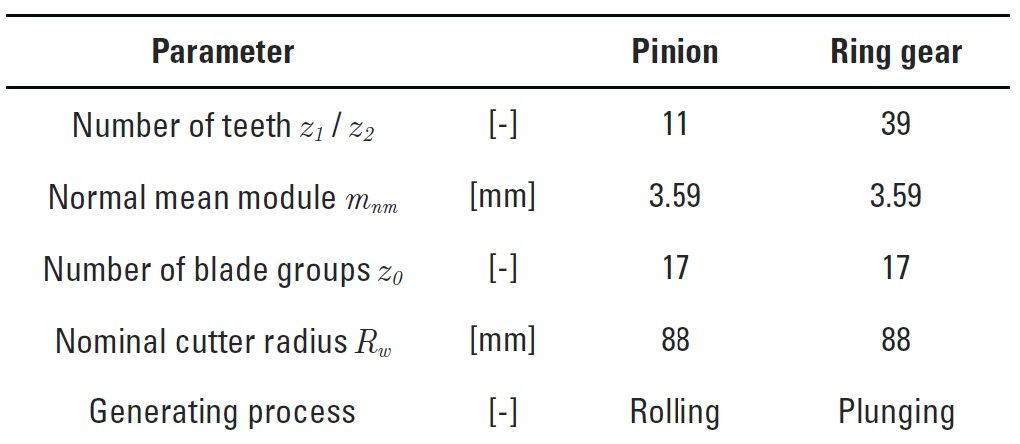 Table 1—Simulation data.
The distribution of the chip thickness hcu is shown in Figure 3. For every cut, different characteristics were calculated. The color gradient represents each cut from the beginning of the process (blue) to the end of the process (red). The superimposed black line represents the maximum value of the characteristics while the gray line shows the mean value.
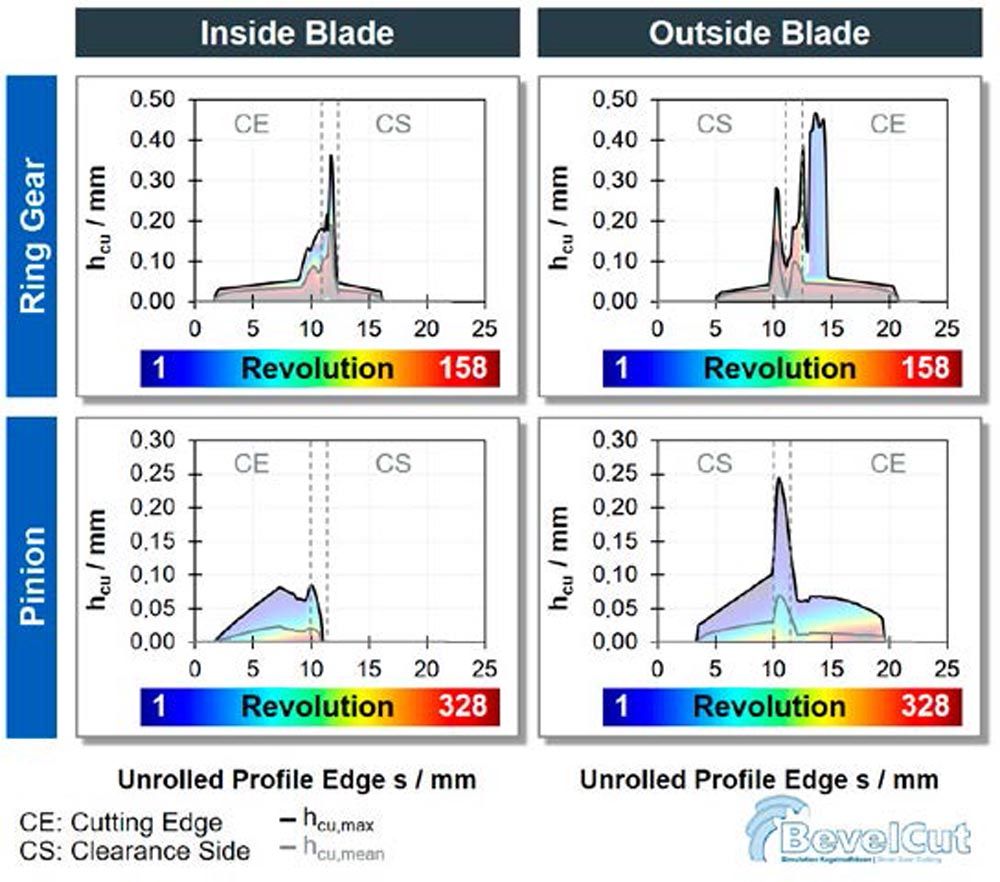 Figure 3—Chip thickness distribution hcu, hcu,max, and hcu,mean.
 The ring gear was manufactured by plunging. The outside blade shows a significantly higher chip thickness hcu than the inside blade. Both blades have a significant portion of the clearance side contributing to machining. The outside blade furthermore shows a larger number of high values for the chip thickness hcu occurring on the radius of the clearance side.
For the pinion, which was manufactured by rolling, the outside blade also displays significantly higher values for the chip thickness hcu than the inside blade. However, the highest maximum chip thickness hcu,max occurs at the tip of the blade. The clearance side of the outside blade contributes to machining to a great extent.
Overall, the values for the chip thickness hcu vary significantly during the cutting process for both pinion and ring gear. The maximum values occur mainly during the initial tool rotations. The course of the chip thickness hcu, however, differs between the ring gear and pinion. The chip thickness hcu at the clearance side indicates the existence of interference. The cuts are differently distributed between ring gear and pinion. For both processes, the outside blade shows the most critical values.
Figure 4 focuses on the number of cuts Ncu on the left and the maximum chip length lcu,max on the right side for the outside blade as it is the most critical one. The maximum number of cuts Ncu is reached at the tip of the ring gear and at the flank of the cutting edge for the pinion. While there is a uniform distribution for the ring gear, the pinion shows a more irregular course with two maxima.
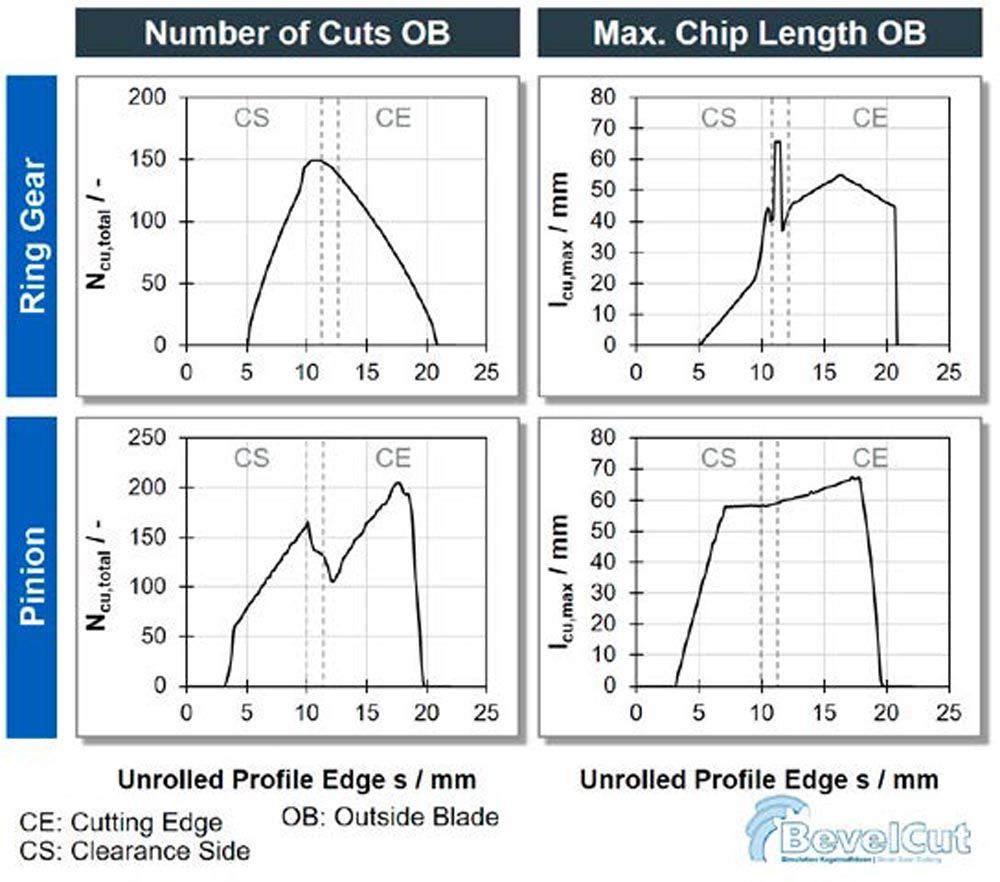 Figure 4—Analysis of the number of cuts Ncu and max. chip length lcu,max.
The peak of the maximum chip length lcu,max occurs at the clearance side radius for the ring gear. The pinion, however, machines the longest chips at the flank of the cutting edge. The clearance side contributes to short chips for the ring gear, but longer chips for the pinion.
As the number of cuts Ncu conveys information on the dynamic load, the highest pulsating load occurs at the tip of the ring gear blade and at the cutting edge of the pinion blade. The chip length lcu allows conclusions on the contact length between the workpiece and tool during the process. The longest contact occurs at the radius of the clearance side for the ring gear and at the flank of the cutting edge when machining the pinion.
The 3D model in Figure 5 shows the total view or the individual flanks of the workpiece including deviations due to manufacturing. Details of the slot outline are visible in the individual intersecting planes. Thus, the noticeable fin occurring in the root of the ring gear can be detected easily and its dimensions can be quantified. The pinion outline shows no fins.
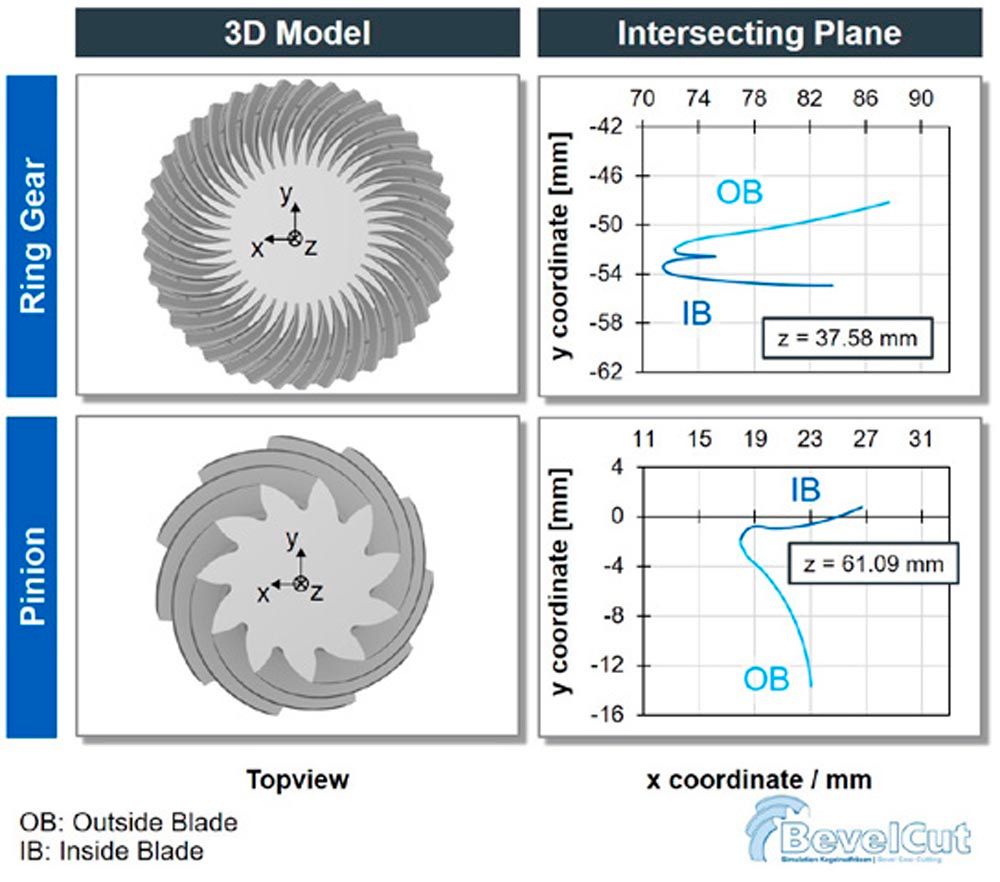 Figure 5—Analysis of resulting workpiece geometry.
Application Suggestions
As the characteristics represent the cutting process, the correlation between the individual variables and cutting phenomena is necessary to optimize the tool and process parameters. Figure 6 gives an overview of the cutting phenomena and the underlying characteristics, whose relevant area is marked with a red circle.
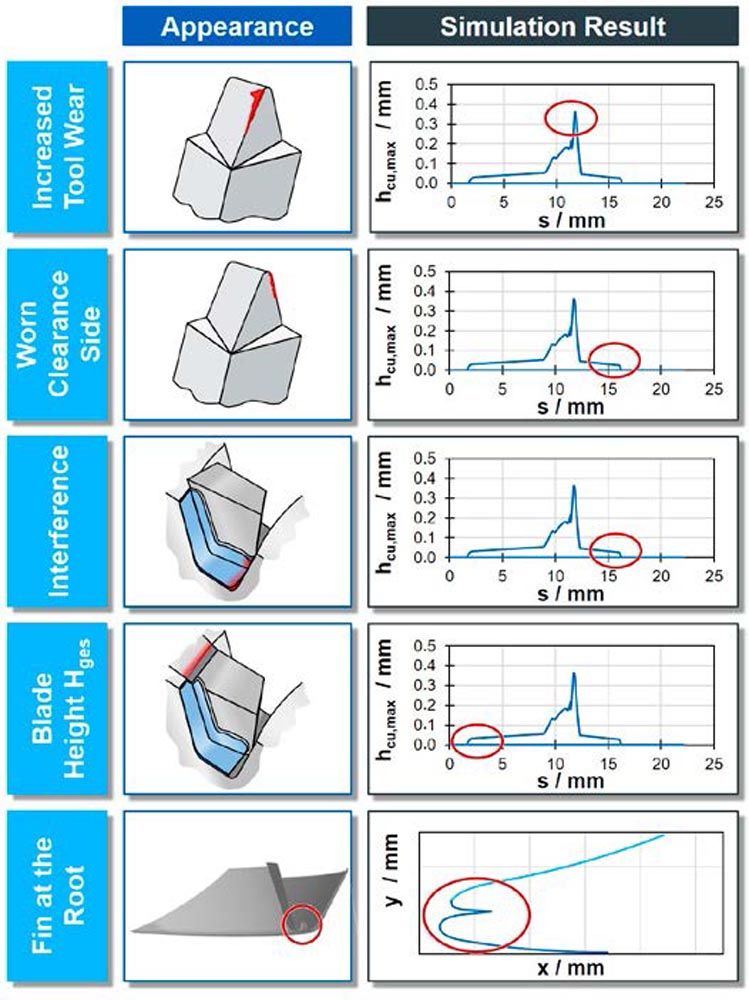 Figure 6—Correlation of characteristics and cutting phenomena.
Tool wear can be influenced by many parameters such as cutting speed, tool angles, tool radii, and feed. The feed directly influences the chip thickness hcu. Areas of increased chip thickness hcu as well as steep gradients or peaks indicate a higher risk for increased or disproportional tool wear. Corrective measures include the identification of where on the profile edge and where during the process these irregularities occur. By adapting the feed ramp accordingly, the chip thickness hcu can be affected. The general blade position as well as changing the feed strategy such as vector feed or modified plunging can affect how the chip load is spread between the inside and outside blade.
Similarly, wear on the clearance side can be detected with the help of the chip thickness hcu as well. Corrective measures for this case focus on avoiding a contribution to cutting. This can be achieved by changing the blade position and spreading the chip load evenly between the inside and outside blades. Adapting the tool geometry to obtain slimmer blades is another measure. If no chip thickness occurs on the clearance side, but wear still occurs, a further analysis of the chip flow will be necessary.
Interference can be detected by the existence of chip thickness hcu on the clearance side. They are usually high but only occur for a short amount of time. Corrective measures include the adaptation of the blade position as well as the inactive tool geometry.
Whether the blade height needs to be adapted can be determined through the position of the chip thickness hcu on the unrolled profile edge. If the entire profile edge contributes to machining, increasing the blade height is advisable to avoid a collision with the shoulder. If the simulation results show a large inactive portion of the profile edge, a reduction of the blade height is advisable. When adapting the blade height, however, the building tolerances during cutter head setup should be taken into consideration.
A fin at the root can be detected when analyzing the resulting workpiece geometry. So far, available design programs give a qualitative, visual output of the root geometry. Currently, there is no detailed possibility for quantitative validation. Corrective measures to avoid fins are the adaptation of the blade position as well as adapting the tool geometry.
Optimized Process Design
For optimization, the same gear design as defined in Table 1 was used. To keep the functionality of the gearset, the flank geometry must remain identical, and the tool and process optimization may not change or interfere. As most problems occurred at the ring gear, the focus is on the simulation results of the ring gear.
Figure 7 shows the effect of the changes on the distribution of the chip thickness hcu. The increase in the blade height resulted in more clearance between the shoulder and the workpiece surface. By decreasing the blade width as well as the clearance radius, the slimmer blades do not interfere with the clearance side anymore. Through an adaption of the position of the inside and outside blades, the chip thickness hcu is more evenly distributed between the blades. As a consequence, the maximum chip thickness hcu,max is reduced significantly and interference was eliminated.
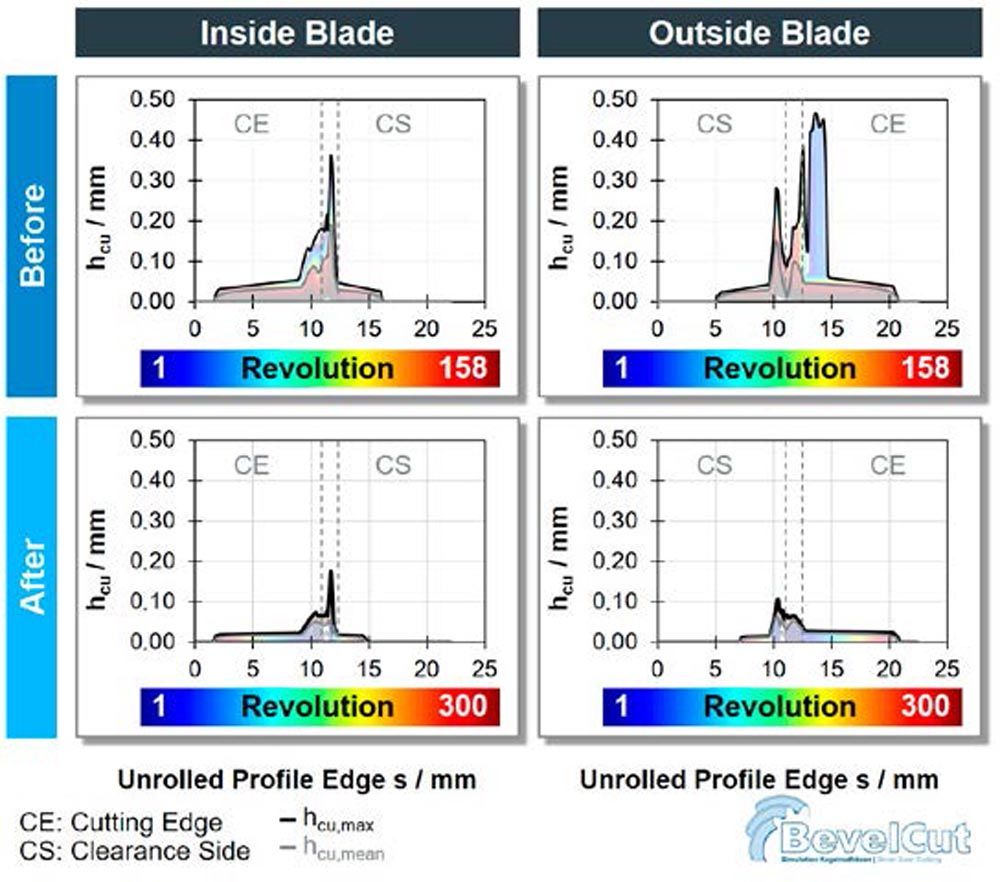 Figure 7—Ring gear chip thickness distribution hcu, hcu,max, and hcu,mean.
To eliminate the fin at the root of the ring gear, further modifications were added to the optimization. The ring gear’s slot geometry with and without the optimization is depicted in Figure 8.
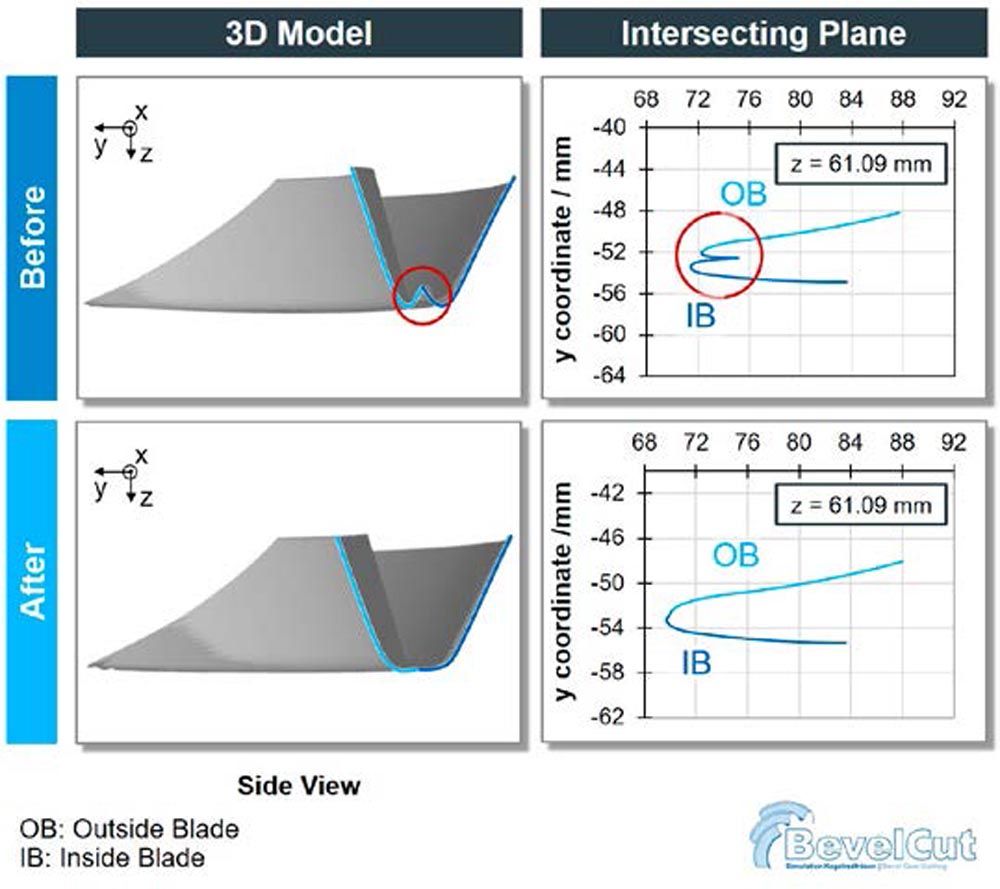 Figure 8—Ring gear slot geometry.
The limitations, however, consisted of not creating interference at the toe again and backlash as well as tooth thickness having to remain the same. As the blade width cannot be increased to cover more of the slot width, the point radius and thus the position of the inside and outside blade were adapted once more. This results in a decreased risk of interference, and a more even distribution of the cut between inside and outside blades is the result. As a consequence, the reductions of the maximum chip thickness hcu,max is reduced and the fin is eliminated. However, this example also illustrates that the challenges in manufacturing and connected phenomena limit the scope of possible changes to tool and process design. Therefore, it is important to determine the quantitative effect of the changes on the cutting characteristics and the resulting workpiece geometry.
Summary and Outlook
In this paper, the mode of operation as well as the current scope of the manufacturing simulation BevelCut was presented. The cutting characteristics for an exemplary design were evaluated for both pinion and ring gear manufactured using face hobbing rolling and plunging. A relationship between the simulation results and cutting phenomena was established. Based on this relationship, corrective measures were deduced. The simulation results show a successful optimization of the tool and process parameters for the gear design. Thus, for the first time, a simulation-based tool and process optimization were conducted for face-hobbing processes.
In the future, the manufacturing simulation will be extended by process modifications such as modified plunging and double roll. Quantifying the height of the fin for the individual intersecting planes will aid in the optimization of the tool design. Implementing algorithms for predicting chip formation will contribute greatly to the analysis of the mentioned challenges and cutting phenomena. For this, a validated cutting force model for bevel gear cutting is necessary.
Acknowledgments
The authors gratefully acknowledge financial support from the WZL Gear Research Circle for the achievement of the project results and the contribution of Dana to this research.
References
- Klingelnberg, J. Bevel Gear: Fundamentals and Applications. Berlin, Heidelberg: Springer Berlin / Heidelberg; 2016.
- Stadtfeld, H. Gleason Bevel Gear Technology: The Science of Gear Engineering and Modern Manufacturing Methods for Angular Transmissions. Rochester, New York: The Gleason Works; 2014.
- Mazak, J. “Method for Optimizing the Tool and Process Design for Bevel Gear Plunging Processes1” [Diss.]. Aachen: RWTH Aachen; 2021.
- Klocke, F. and Brecher, C. Zahnrad- und Getriebetechnik: Auslegung - Herstellung - Untersuchung - Simulation. 1st ed. München: Carl Hanser; 2017.
- Habibi, M. “Tool Wear Improvement and Machining Parameter Optimization in Non-generated Face-hobbing of Bevel Gears” [Diss.]. Montreal: Concordia University; 2016.
- Herzhoff, S. “Werkzeugverschleiß bei mehrflankiger Spanbildung” [Diss.]. Aachen: RWTH Aachen University; 2013.
- Klocke, F.; Gorgels, C.; and Herzhoff, S. “Tool Load during Multi-Flank Chip Formation,” Adv. Mater. Res., 2011, Vol. 223, pp. 525–534. doi:10.4028/www.scientific.net/AMR.223.525.
- Kamratowski, M.; Alexopoulos, C.; Brimmers, J.; and Bergs, T. “Model for tool wear prediction in face hobbing plunging of bevel gears,” Wear, 2023. doi:10.1016/j.wear.2023.204787.
- Rütjes, U.A. “Entwicklung eines Simulationssystems zur Analyse des Kegelradfräsens” [Diss.]. Aachen: RWTH Aachen University; 2010.
- Brecher, C.; Gorgels, C.; and Hardjosuwito, “A. Simulation-based Tool Wear Analysis in Bevel Gear Cutting.” In: VDI, editor. International Conference on Gears; 4. - 6. Oktober 2010; Garching. Düsseldorf: VDI; 2010.
- Brecher, C.; Gorgels, C.; and Hardjosuwito, “A. Simulation Methods for Beveloid Gears.” In: Brecher, C. and Klocke, F., editors. 3rd WZL Gear Conference in the USA; 13./14. Oktober 2010. Boulder, Colorado; 2010.
- Brecher, C.; Löpenhaus, C.; and Mazak, J. “Manufacturing Simulation for Bevel Gear Cutting Based on a Two-Dimensional Penetration Calculation.” In: p. 1387–1398.


 Introduction and Motivation
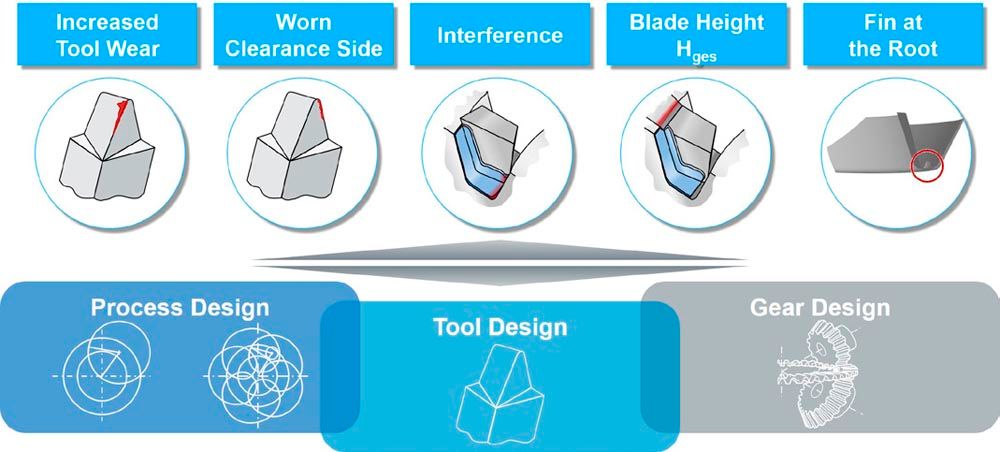 Figure 1—Challenges in bevel gear manufacturing.